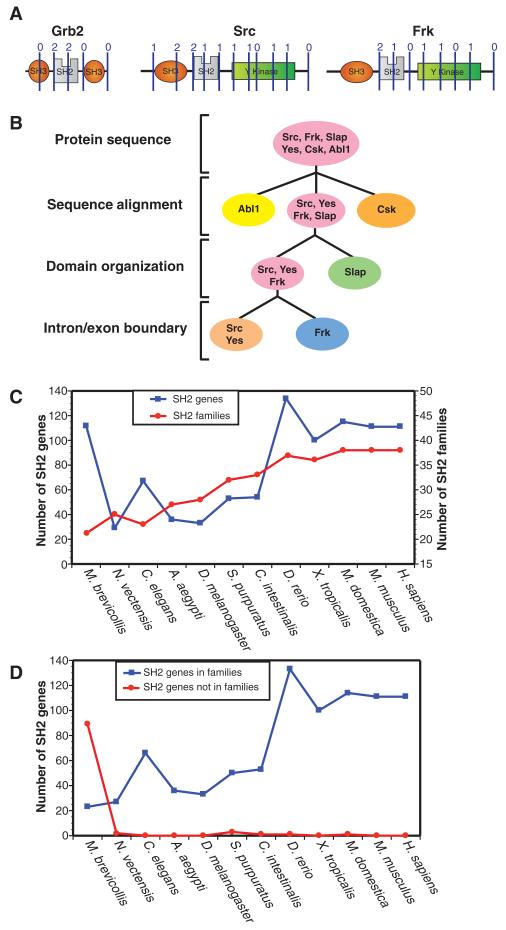
Fig. 2.
The classification of SH2 families. (A) Genomic structure was mapped as intron-exon boundary positions overlaid on the secondary structural motifs of SH2 domains as an additional means of assessing relatedness. Intron and exon splice sites of three example SH2 proteins, indicated with lines and numbers above, were identified with SMART and Ensembl (see Materials and Methods). A ClustalW alignment and hierarchical clustering of human SH2 domains with the splice sites indicated can be found in fig. S3. (B) A hierarchical method for defining SH2 domain families by protein sequence alignment (ClustalW), domain organization (SMART and CCD), and intron/exon splicing patterns (Ensembl and SMART) was developed to define SH2 domain families. The flow chart follows the classification method to distinguish between representative SH2 proteins with similar primary sequences: Abl1, Csk, Slap, Yes, Src, and Frk. (C) The graph represents the number of SH2 proteins and the conserved SH2 families for 11 organisms from H. sapiens and M. brevicollis. (D) The number of proteins that can or cannot be classified into one of the 38 families (table S3).

