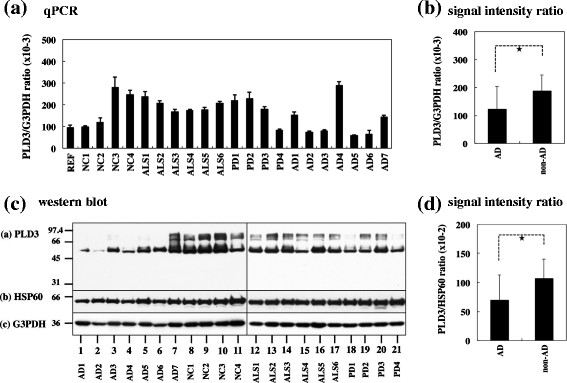
Figure 2.

Reduced expression of PLD3 mRNA and protein in Alzheimer’s disease brains. (a), (b) PLD3 mRNA expression. mRNA expression was studied by quantitative reverse transcription-polymerase chain reaction (qPCR) in human brain tissues derived from a reference of the human frontal cortex (REF), four non-neurological controls (NC), six amyotrophic lateral sclerosis (ALS) patients, four Parkinson’s disease (PD) patients, and seven Alzheimer’s disease (AD) cases. PLD3 expression levels were standardized against those of glyceraldehyde-3-phosphate dehydrogenase (G3PDH), and the statistical significance in difference between AD and non-AD groups was evaluated by Student’s t test. *P =0.0499 (PLD3 vs. G3PDH). (c), (d) PLD3 protein expression. Protein expression was studied by western blot in human brain tissues derived from four NC, six ALS patients, four PD patients, and seven AD cases. PLD3 expression levels were standardized against those of HSP60 or G3PDH, and the statistical significance in difference between AD and non-AD groups was evaluated by Student’s t test. *P =0.0416 (PLD3 vs. HSP60). PLD, phospholipase D.
