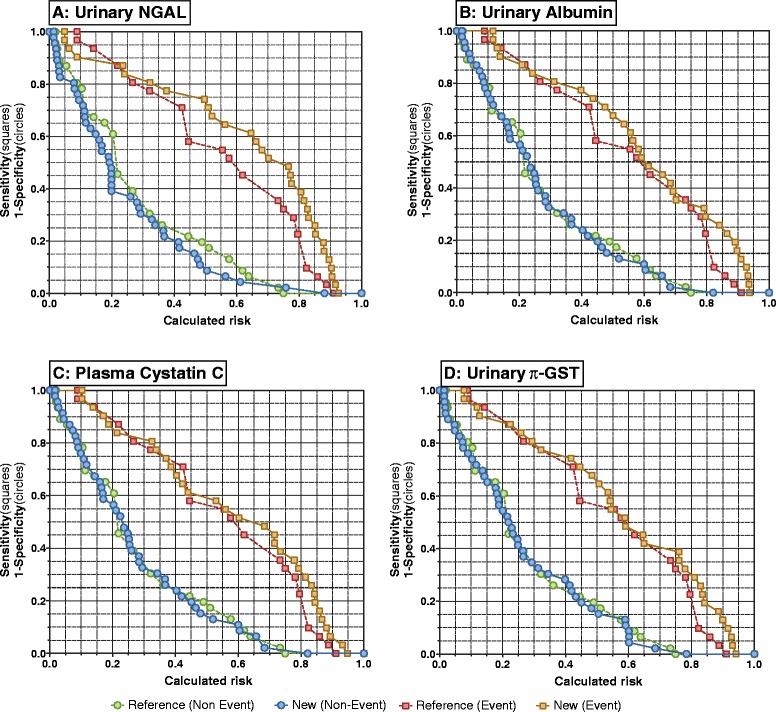
Figure 4.

Risk assessment plots showing the additional value of individual biomarkers compared with the reference model for prediction of the composite of mortality or dialysis. The reference model included the modified acute physiological and chronic health evaluation (APACHE) II score (without creatinine score), and AKI24 (present or absent). The new models comprised the reference model plus peak (A) urinary neutrophil gelatinase-associated lipocalin (NGAL), (B) urinary albumin (C) plasma cystatin C, or (D) urinary π-glutathione-S-transferase (GST) within 24 h. Event curves (squares) are sensitivity versus calculated risk. Non-event curves (circles) are 1-specificity versus calculated risk.
