
Figure 2.
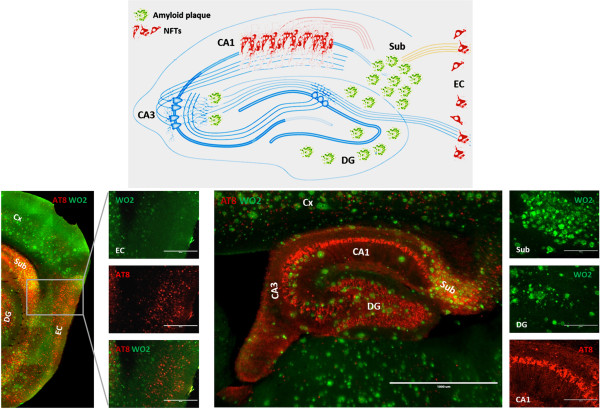
Graphical representation of the regional distribution of amyloid plaques and NFTs in hippocampus and entorhinal cortex (upper panel, hippocampal-entorhinal connectivity map modified after Deng et al. [61]). Analysis of the relation between amyloid plaques (anti-Aβ, WO2, green) and Tau-pathology (anti-pTau, AT-8, red) in entorhinal cortex (lower left panel) and hippocampus (lower right panel) of F+/T+ transgenic mice, with details of the regional distribution of amyloid- and Tau-pathology for each of these regions.