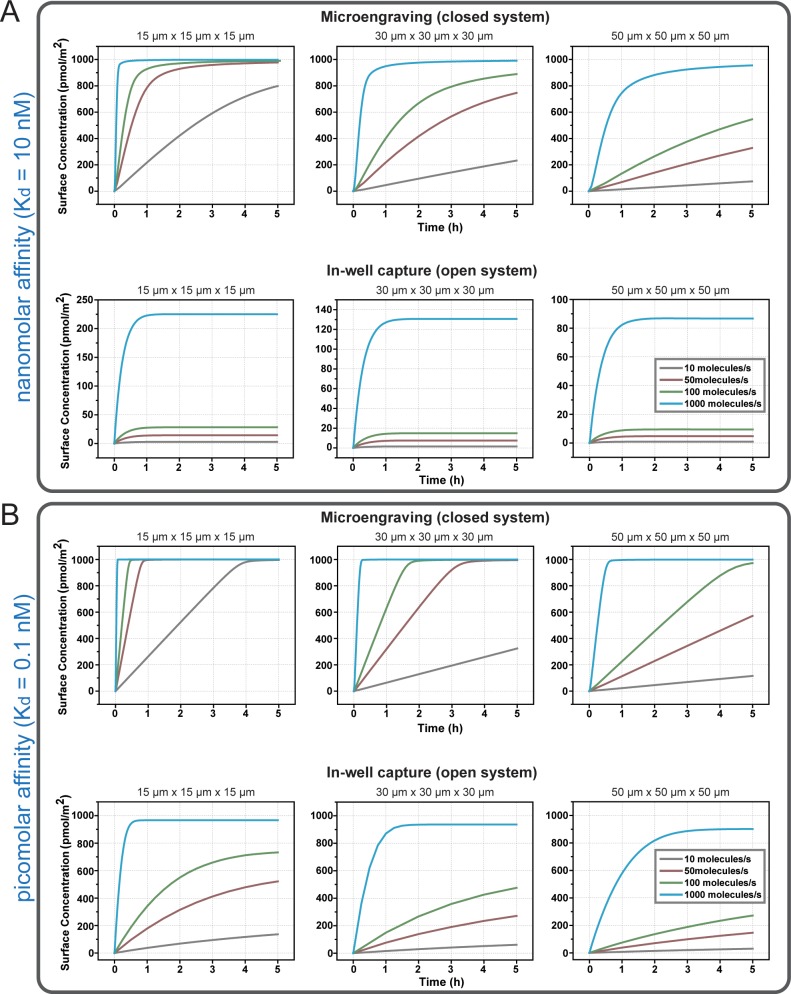
Figure 3.
Time-dependent interfacial concentrations of proteins captured from a single cell in open and closed configurations. Plots depict the average surface concentration of secreted analyte bound to the capture surface for both microengraving and in-well capture, as a function of the rates of secretion and dimensions of the nanowells. The equilibrium association-binding constant used for these plots are (A) Kd = 10 nM and (B) Kd = 0.1 nM.

