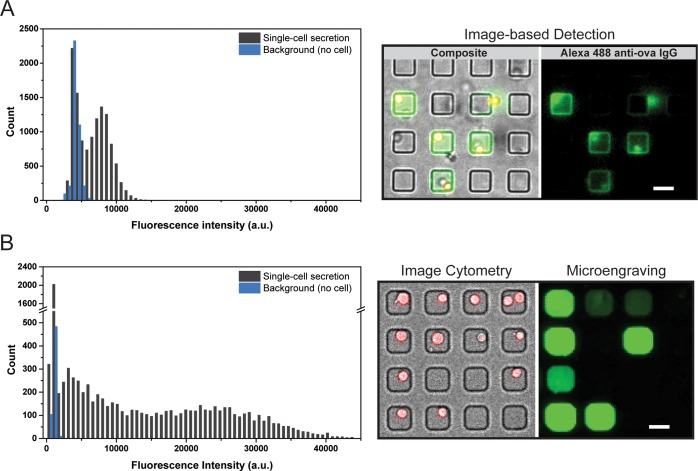
Figure 5.
Experimental comparison of in-well capture and microengraving. Intensity distribution of Alexa 488 anti-mouse IgG used to detect secreted ovalbumin specific antibodies from the hybridoma cells. (A) Intensity distribution from detected surface captured analyte in the in-well capture configuration. (B) Intensity distribution obtained by microengraving. The blue histogram represents background florescence obtained from wells with no cells; the black histogram shows the mean fluorescent intensities quantified for wells with single cells (total fluorescence per unit area). Scale bar = 30 μm.

