
Fig 7.
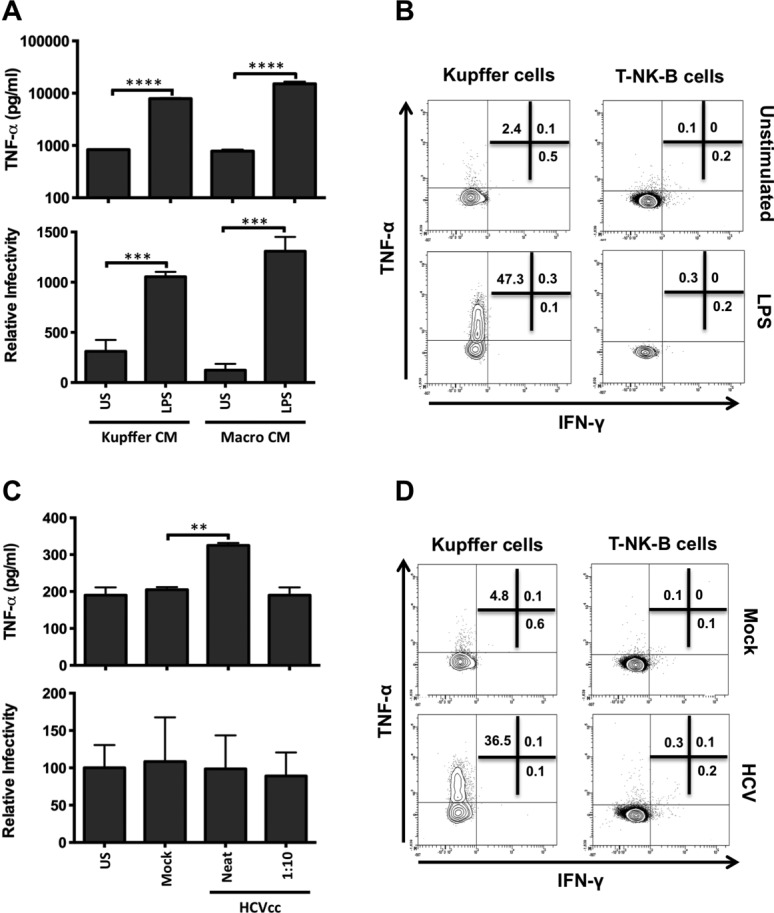
Kupffer cells express TNF-α but not IFN-γ following LPS and HCV stimulation. (A) Intrahepatic KCs or peripheral blood-derived macrophages were stimulated for 24 hours with LPS (10 μg/mL), CM collected and assayed for TNF-α (upper graph), and effect on HCVpp infection of polarized HepG2.CD81 cells (lower graph). (B) Intrasinusoidal monocytes and lineage-positive (T-NK-B) cells were stimulated with LPS (10 μg/mL) for 6 hours and intracellular TNF-α and IFN-γ expression assessed by flow cytometry. (C) Intrahepatic KCs or peripheral blood-derived macrophages were incubated with HCV (strain SA13/JFH) or mock at an estimated multiplicity of 22 (Neat) or 2.2 (1:10), as defined by HCV-RNA copies/cell. CM was collected and assayed for TNF-α (upper graph) and effect on HCVpp infection of polarized HepG2.CD81 cells (lower graph). (D) Intrasinusoidal monocytes and lineage-positive (T-NK-B) cells were stimulated with HCV (neat) or mock antigen for 6 hours and intracellular TNF-α and IFN-γ expression assessed by flow cytometry. Data are represented as mean ± SD (n = 2 independent experiments). ***P < 0.001, **P < 0.01, *P < 0.05.