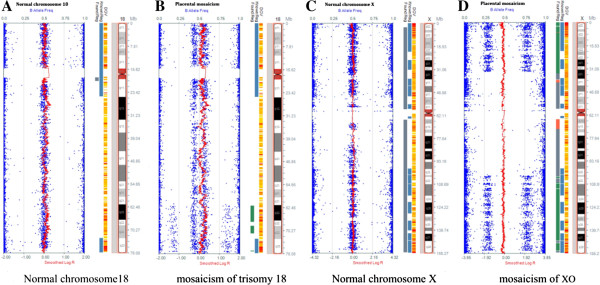
Figure 5.

Illumina SNP array result showing the presence of mosaicism of placental tissue. A. A view of normal chromosome 18 as control of SNP array (Illumina HumanCytoSNP-12). The upper axis indicates the value of B allele frequency (BAF, blue dots). BAF may have three values (1 for BB, 0.5 for AB and 0 for AA) in a diploid individual. Additionally, the lower axis indicates the logR ratio (red line), where R illustrates the ratio of each SNP compared to diploid individuals in chromosome 18 (a logR ratio of 0 means an actual ratio of 1). B. A SNP array of placental tissue with mosaic trisomy 18. The BAF values (1 for BBB and BB; 0.6 for ABB and AB; 0.4 for AAB and AB; and 0 for AAA and AA) and the increased logR ratio indicated a mosaicism. Partial duplication in distal region of 18q was also observed. C. A view of normal chromosome X as control of SNP array (Illumina HumanCytoSNP-12). D. A SNP array of placental tissue with mosaic monosomy X. The BAF values (1 for BB; 0.75 for BB and BO; 0.25 for AA and AO; 0 for AA) and the decreased logR ratio indicated a mosaicism.
