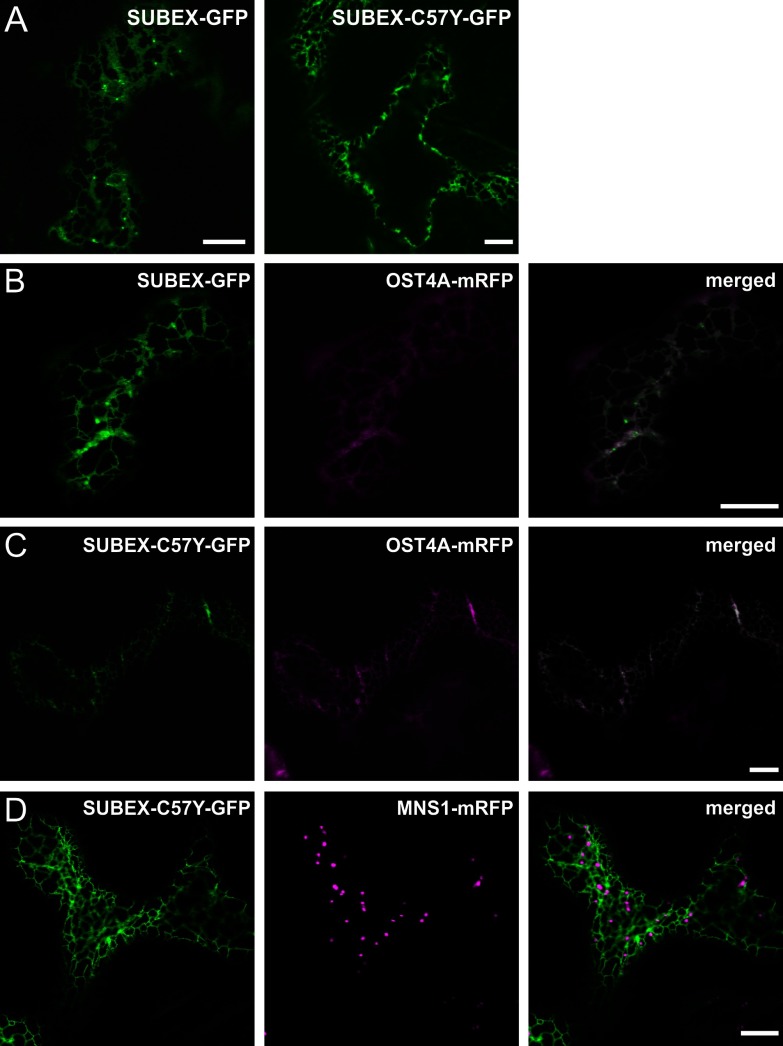
Figure 2. SUBEX and SUBEX-C57Y display ER-localization.
(A) SUBEX-GFP and SUBEX-C57Y-GFP respectively were transiently expressed in N. benthamiana leaf epidermal cells and analysed by confocal microscopy. (B) Expression of SUBEX-GFP (green) together with the ER-marker OST4A-mRFP (magenta) showing co-location (merged image). (C) Expression of SUBEX-C57Y-GFP (green) together with the ER-marker OST4A-mRFP (magenta) showing co-location (merged image). (D) Co-expression of SUBEX-C57Y-GFP (green) and the Golgi-marker MNS1-mRFP (magenta) indicates specific ER-localization of SUBEX-C57Y-GFP. Scale bars=10 μm.

