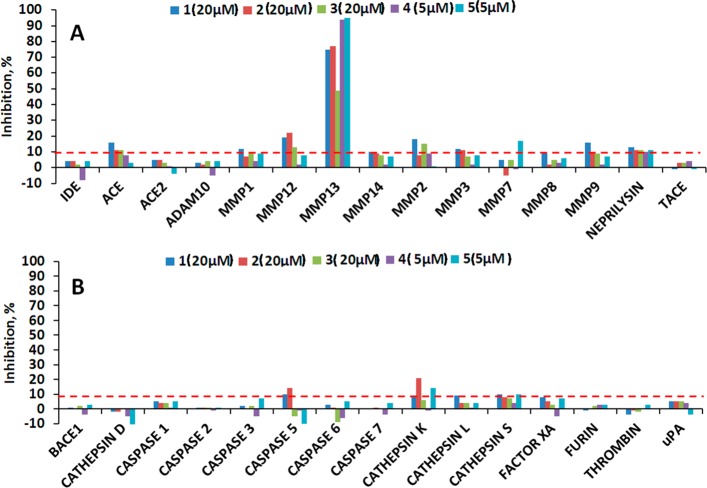
Figure 5.
Results of protease panel profiling assays. Test compounds were screened in 12-point 3-fold dilution dose–response curve format. The activity of each enzyme was determined as the conversion (%) of the substrate to product after 3 h of incubation. (A) Metalloprotease panel results at the highest compound concentration tested. (B) Serine, cysteine, and aspartic protease panel results at the highest compound concentration tested.

