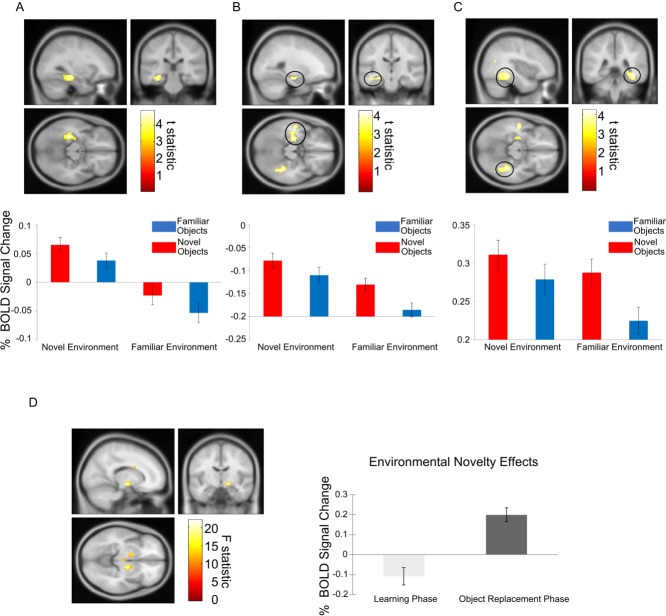
Figure 2.
Environmental and object novelty during the navigation task. A: Left hippocampal activity corresponding to environmental novelty during navigation (above; peak voxel: x = −30; y = −28; z = −14; Z-score = 4.65; including both learning and object replacement phases). Percent signal change in a 10 mm sphere around the left hippocampal peak for all four conditions (navigating toward or replacing novel or familiar objects within novel or familiar environments, below, showing mean ± SEM over the 18 participants). B: Left anterior hippocampal activity, extending into the amygdala and superior temporal sulcus, corresponding to object novelty during navigation (above, peak voxel: x = 39; y = −40; z = −14; Z-score = 3.81). Percent signal change in a 10 mm sphere around the left anterior hippocampal peak for all four conditions (below, mean ± SEM). C: Left parahippocampal/fusiform activity corresponding to object novelty during navigation (above, peak voxel: x = 39; y = −40; z = −14; Z-score = 4.10). Percent signal change in a 10 mm sphere around the left parahippocampal/fusiform peak for all four conditions (mean ± SEM). D: Right ventral pallidum activity corresponding to the interaction between environmental novelty and experimental phase (left; peak voxel: x = 15; y = −10; z = −8; Z-score = 4.34; left ventral pallidum and midbrain/VTA effects visible in axial slice). Percent signal change in a 10 mm sphere around the right ventral pallidal peak during navigation in novel versus familiar environments during the learning and replacement phases (mean ± SEM). All activations are shown at the uncorrected threshold of P < 0.001 for display purposes and overlaid on the Montreal Neurological Institute 152 T1 image. [Color figure can be viewed in the online issue, which is available at wileyonlinelibrary.com.]

