
Figure 3.
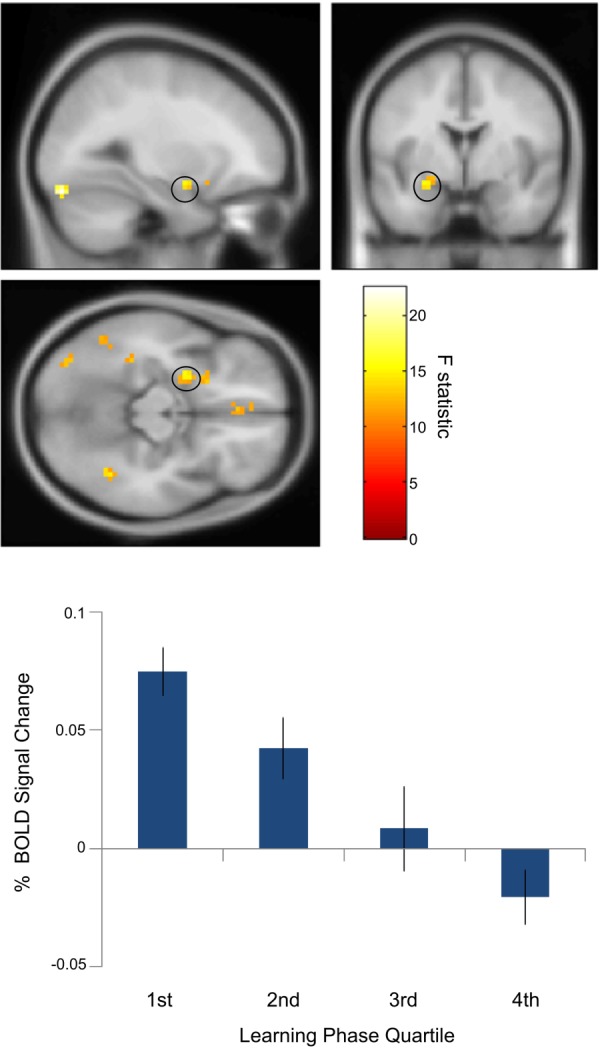
Temporal attenuation of amygdala object novelty effect. Above: Left amygdala activity (peak: x = −27; y = −1; z = −14; Z-score = 3.65) corresponding object novelty (novel versus familiar objects) showed a linear decrease over the course of the learning phase as relative novelty decreased. Below: Percent signal change extracted from a 10 mm sphere around the peak left amygdala voxel averaged across 18 participants for novel versus familiar objects for the first to fourth quartile of the learning phase. Activations are shown at the uncorrected threshold of P < 0.001 and overlaid on the Montreal Neurological Institute 152 T1 image for display purposes. [Color figure can be viewed in the online issue, which is available at wileyonlinelibrary.com.]