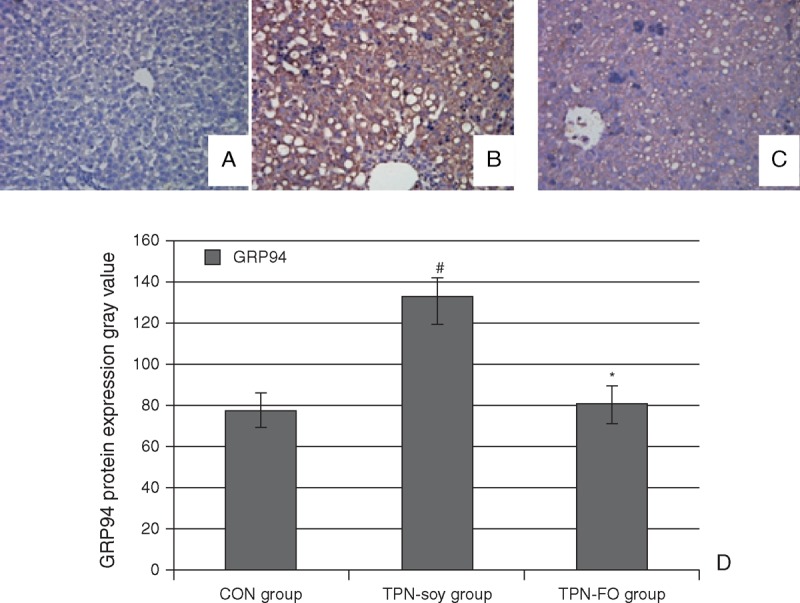
FIGURE 3.

Immunohistological analysis of GRP94 protein in liver tissues. Representative results of GRP94 staining in samples derived from (A) control, (B) TPN-soy group, and (C) TPN-FO group. Quantitative data (D). Original magnification ×400. #P < 0.01, compared with control; ∗P < 0.01, compared with TPN-soy. GRP94 = glucose-regulated protein 94; TPN = total parenteral nutrition; TPN-FO = TPN with ω-3 fish oil; TPN-soy = TPN with soybean oil.
