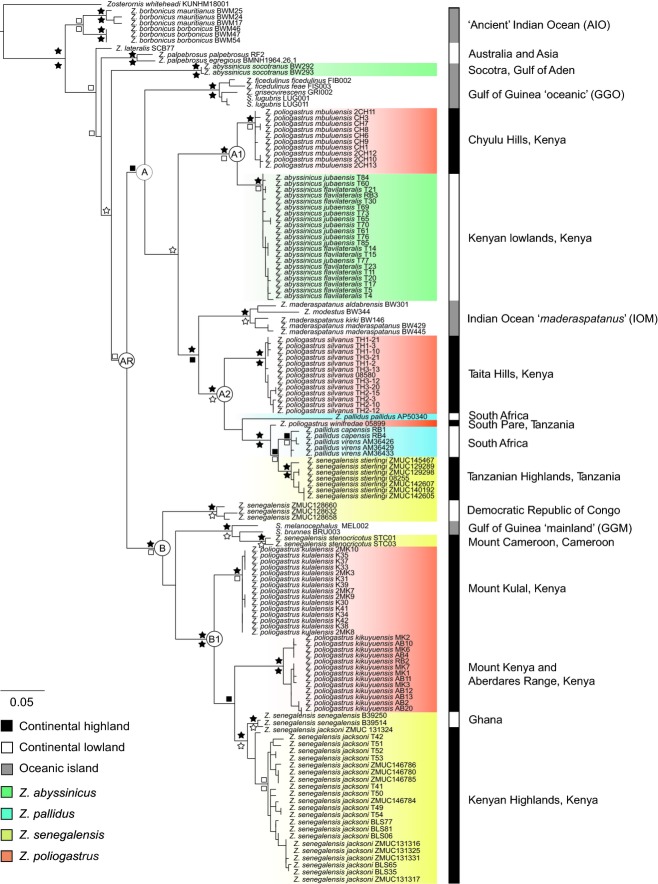
Figure 2.
Phylogenetic tree of African Zosterops generated using Bayesian inference based on ND3 and Cyt b data. Bayesian posterior probabilities (BPP) are indicated above branches, with ML bootstrap (BS) values below branches. Support values are represented by the symbols: black star >95% BPP/BS, white star >90% BPP/BS, black square >80% BPP/BS, white square >50% BPP/BS. Nodes with <50% support are unmarked. Key nodes are labelled AR (African Radiation), A-A2 and B-B1. Taxa are labelled using full trinomial nomenclature following the taxonomy of Dickinson (2003).

