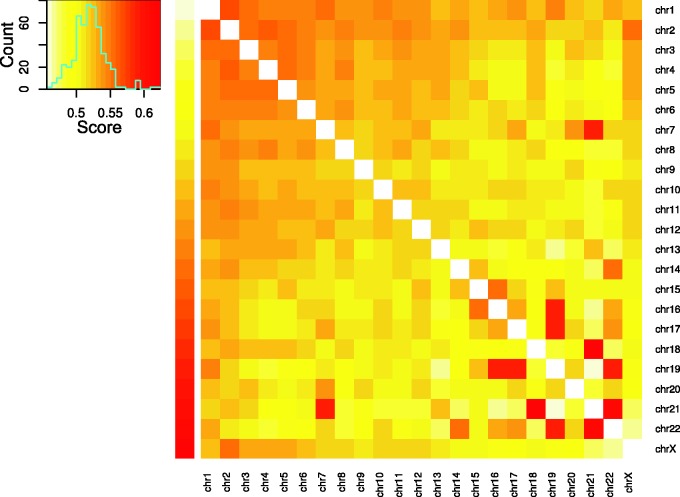
Fig. 3.—
Heat map of the interchromosomal translocated fragment pairs. The color key changes from light yellow (low enrichment scores) to red (high scores). The upper left panel is the histogram of the enrichment scores. The cell in the heat map shows the interchromosomal translocated fragments enrichment score between the corresponding chromosomes.

