
Figure 3.
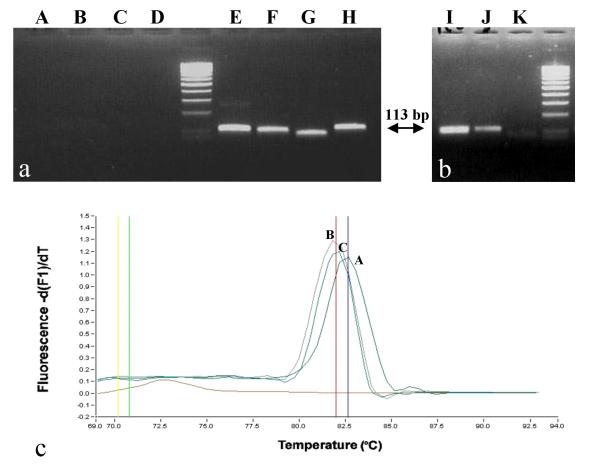
Molecular detection and identification of true and false positives using plasmid CatA as positive control. 3a. NotI predigestion of CatA plasmid DNA. A, B, C, D correspond to Not I digested-CatA plasmid DNA (overnight digestion with 10 U followed by an 1-hour digestion with another 10 U) respectively PCR amplified with Y. pestis, F. tularensis, B. anthracis, and smallpox virus oligonucleotide primers. E, F, G, H correspond to the same DNA samples which have not been digested by NotI. 3b. Discrimination of Y. pestis amplicons by NotI post-PCR digestion in a 3% agarose gel. lane I, NotI post-PCR digestion of amplicon from Y. pestis native DNA (101 bp); lane J, amplicon from CatA plasmid DNA (113 bp); lane K, NotI post-PCR digestion of amplicon from CatA plasmid DNA (digestion result in 2 products of 76 bp and 37 bp, respectively; only the 76 bp product is seen). 3c. Melting curves obtained from SYBR Green Light Cycler reactions. Curve A was obtained with CatA plasmid DNA and Y. pestis primers; curve B was obtained with Y. pestis DNA amplified with Y. pestis specific primers; curve C was obtained with Y. pestis DNA amplified in a multiplex reaction including the 8 primers specific for the category A agents (Y. pestis, F. tularensis, B. anthracis, smallpox virus). The melting temperature observed with A is 82.65 whereas it is 81.97 with native Y. pestis DNA (curves B and C).