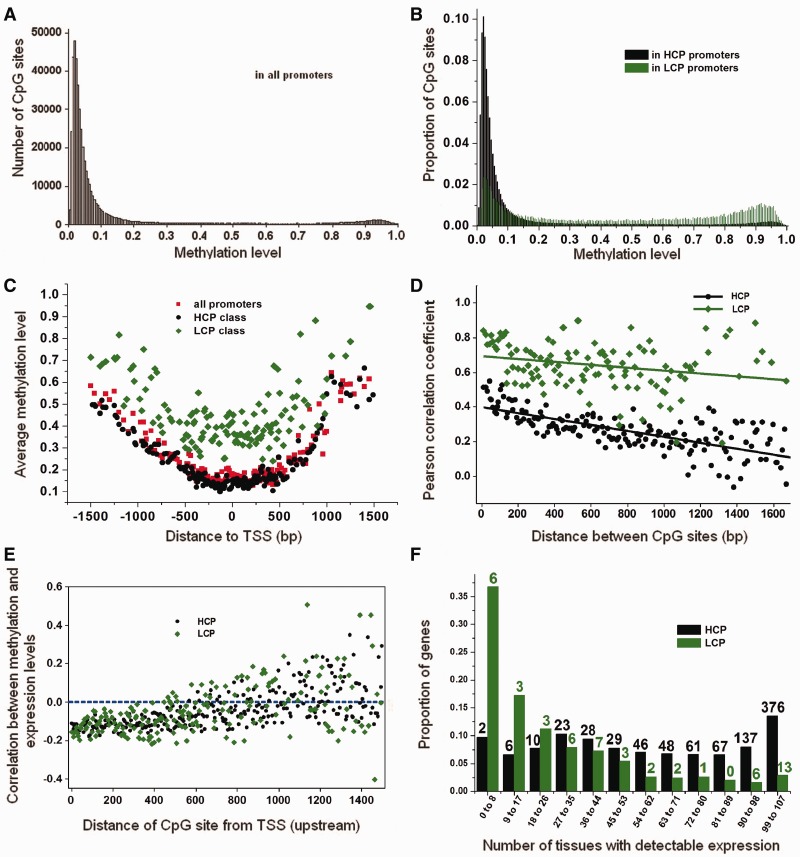
Fig. 5.—
Methylation and gene expression patterns across 28 human tissues. Methylation levels of CpG sites in all promoters (A), and in HCP and LCP (B), across 28 different human tissues. The average methylation levels with respect to the TSS, with each point representing the average methylation level in an interval of 10 bp (C). The correlation of methylation levels between all pairwise CpGs sites in the same promoter, with each point showing the average correlation in 10-bp intervals according to the distance between CpG sites (D). The correlation coefficient between methylation and gene expression level with increasing distance from the TSS (E). Distribution of the number of tissues in which HCP and LCP genes are expressed. Each bar is labeled with the corresponding number of expressed housekeeping genes as identified in Zhu et al. (2008) (F).

