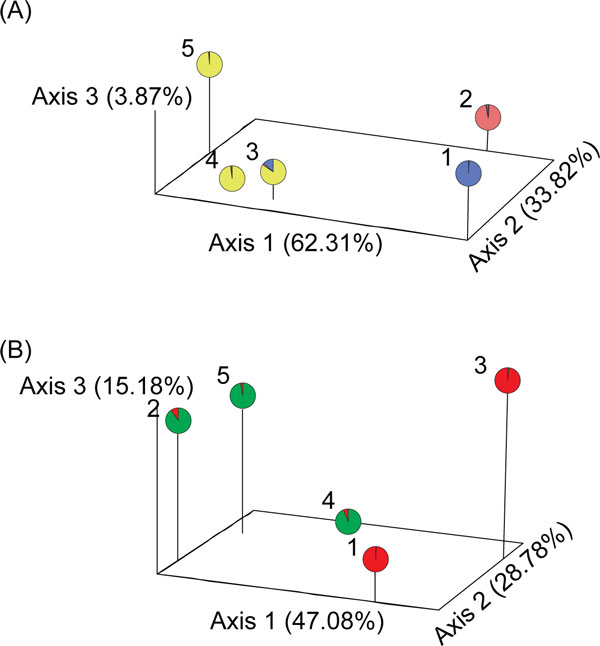
Figure 5.

Three-dimension plot of Principle Coordinate Analysis (PCoA) and STRUCTURE analyses. The planes of the first three principle coordinates 62.31%, 33.82%, and 3.87% of total genetic variation, respectively, derived from five variable microsatellite loci (A). The planes of the first three principle coordinates 47.08%, 28.78%, and 15.18% of total genetic variation, respectively, derived from four Y-pseudo-linked microsatellite loci (B). The pie graph represents average membership distribution to three (A) and two (B) clusters, respectively. 1, B. dorsalis Salaya1 strain; 2, B. dorsalis wild strain; 3, B. carambolae Salaya5 strain; 4, B. carambolae Jakarta strain; 5, B. carambolae Sumatra strain.
