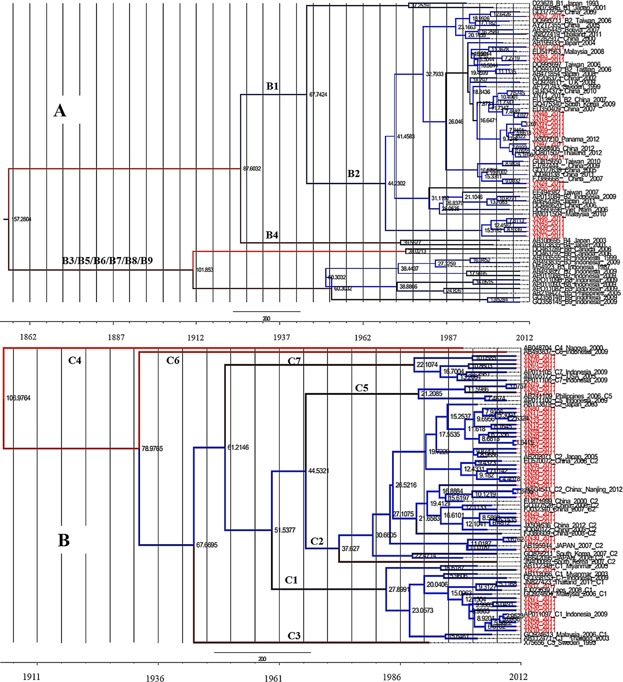
Fig 3.

Maximum clade credibility (MCC) trees were estimated by Bayesian analysis on HBV genotype B and C sequences. Yunnan strains are indicated in red. The internal numbers are node ages. The scale at the bottom of the tree represents the time (year).
