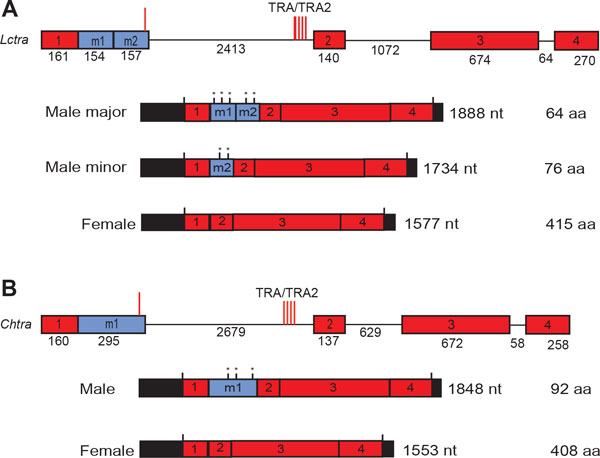
Figure 3.

Comparison of the genomic organization and sex-specific transcripts of the L. cuprina and C. hominivorax transformer genes. The diagrams represents the Lctra (A) and Chtra genes (B). The exons are shown as square boxes, with exons in red representing common exons to both female and male mRNAs. Exons m1 and m2 in blue represent male specific exons. Introns are represented by solid lines. Exon and intron sizes are indicated. Red vertical lines represent the position of putative TRA/TRA2 binding sites within the male exon and the first intron. The male and female transcripts are shown below the genes. The 5' and 3' untranslated regions are represented by black boxes. Vertical black lines mark translational start and stop sites and in-frame translational stop sites in the male exons are marked with asterisks. The predicted lengths of the proteins encoded by the transcripts are indicated. Lctra and Chtra have a very similar exon-intron arrangement and sex-specific splicing pattern. Modified from [37].
