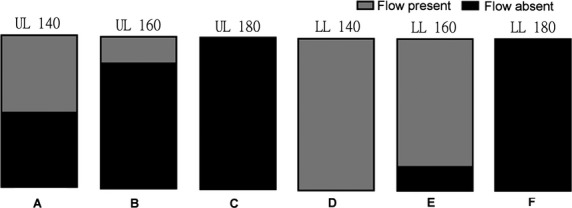
Figure 2.

Illustration of the fraction of the total number volunteers (n =6) in whom arterial blood flow was occluded (shown in black) at each cuff inflation pressure per limb. (A) 140 mmHg (UL); (B) 160 mmHg (UL); (C) 180 mmHg (UL); (D) 140 mmHg (LL); (E) 160 mmHg (LL); (F) 180 mmHg (LL); UL, upper limb, LL, lower limb.
