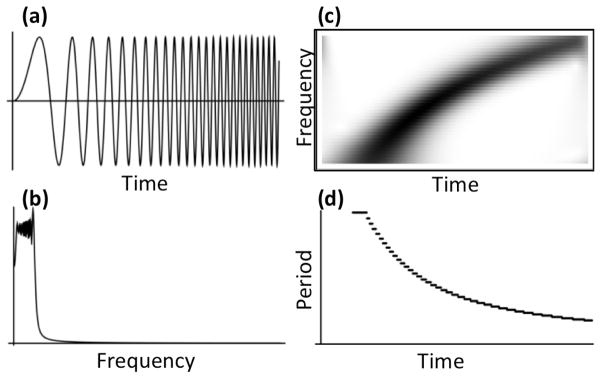
Fig. 1.

Comparison of Fourier transform and the continuous wavelet transform. (a) A signal whose frequency increases over time. (b) The absolute value of the Fourier transform of the signal in a. (c) The continuous wavelet transform of the signal in a. Notably, the wavelet transform shows clearly that the signal is increasing in frequency over time while the Fourier transform shows only that low frequencies are dominant. (d) Plot of the significant period over time of the signal in (a), calculated by taking the most significant wavelet wavelength from (c) at each time with a minimum significance of 0.2.
