
Fig. 2.
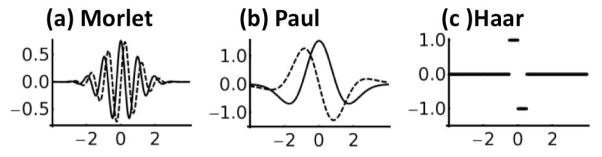
Plots of the three wavelets used in this study, as described in Table 1, each plotted from −4 to 4 with scale s = 1. Solid lines represent the real parts while dashed lines represent the imaginary parts. (a) The Morlet wavelet. (b) The Paul wavelet. (c) The Haar wavelet.