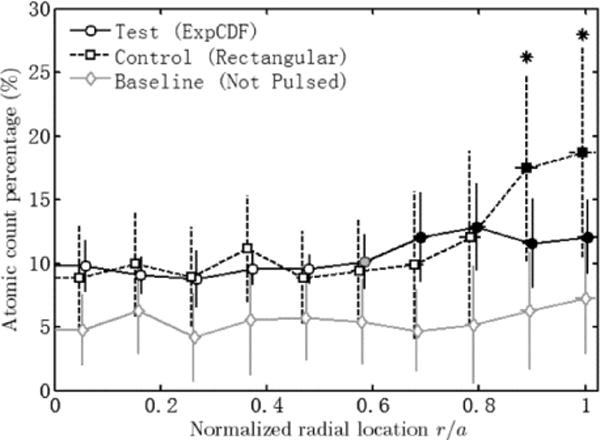
Fig. 9.

Atomic count percentage of oxygen along disk radius. The data points were slightly offset at each location for clarity. Error bars show standard deviation. Asterisks indicate significant difference between test and control groups. Filled and empty markers indicated center and periphery subgroups within each group. The grey marker of test group is transition between center and periphery subgroups.
