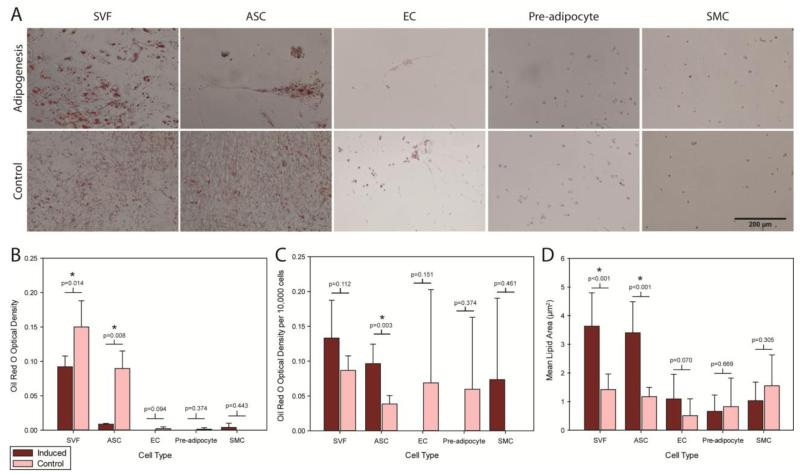
Figure 3.
Adipogenic differentiation was assessed by ORO staining of intracellular lipids. (A) Adipogenically induced samples are shown on the top row, with corresponding controls depicted on the bottom row (Scale bar = 200 μm). (B) Optical densities corresponding to eluted ORO stain indicated no significant lipid production occurred in induced samples over controls on a per sample basis. (C) When normalized to the number of cells in each sample, more robust lipid production was observed in sorted ASCs than unsorted SVF cells, ECs, pre-adipocytes, and SMCs (* p < 0.05). (D) Mean lipid droplet size measurements showed induced SVF cells and ASCs produced significantly larger lipids over control cells, which produced smaller, uniformly distributed lipids throughout the samples (* p < 0.05). Data are presented as Mean ± SD. Student’s t-test determined statistical significance.

