Figure 8.

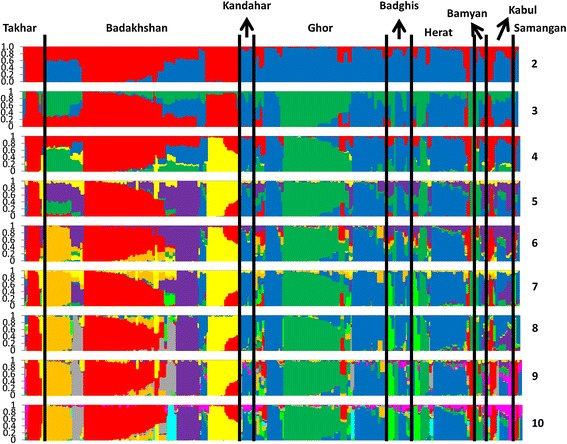
Principal component analysis of Afghan wheat landraces. The first coordinate explained 52.7% of the variability, while the second one accounted for an additional 17.6%.

Principal component analysis of Afghan wheat landraces. The first coordinate explained 52.7% of the variability, while the second one accounted for an additional 17.6%.