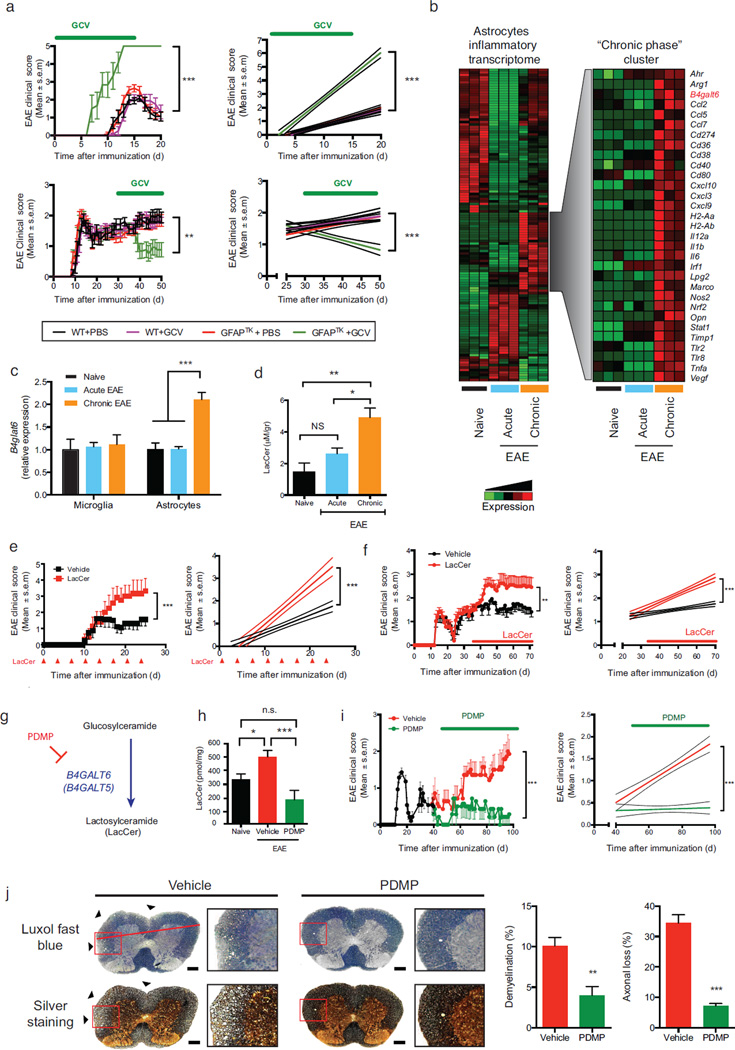
Figure 1. B4GALT6 activity controls CNS inflammation and neurodegeneration.
(a) EAE scores in wild type (WT) and GFAP-TK transgenic (GFAPTK) F1 hybrid mice (mean and s.e.m.). Right panel, linear-regression curve; dashed lines indicate 95% confidence interval of the regression line. Mice were treated daily with Ganciclovir (GCV, 25mg/kg) or vehicle (PBS) as indicated (green bar). Representative data of three independent experiments with n ≥ 7 mice/group. (a, upper panel) Mice were pretreated 7 days before EAE induction and continuously until day 15, (a, lower panel) or were treated only during the progressive phase (days 30–50). (b, left panel) Heatmap depicting the differential mRNA expression profiles in astrocytes isolated from the CNS of naïve NOD mice, or during the acute or the progressive phase of NOD EAE, as detected by Nanostring nCounter analysis; Representative data of three independent experiments. (b, right panel) Heatmap depicting a unique gene cluster specifically up-regulated during the progressive phase of EAE. (c) qPCR analysis of b4galt6 expression in microglia or astrocytes from naïve or EAE NOD mice; expression normalized to gapdh and presented relative to that of cells from naïve mice. Representative data of three independent experiments, statistical analysis by Student’s t-test. (d) Quantification of lactosylceramide (LacCer) in the CNS of naïve or EAE NOD mice, relative to net tissue weight. Representative data of three independent experiments with n ≥ 15 samples per condition, statistical analysis by Student’s t-test. (e, f) EAE clinical scores in C57BL/6 (e) and NOD (f) mice following administration of LacCer (10µg per mouse) or vehicle as indicated by red arrows or bar. Representative data of two independent experiments with n ≥ 8 mice/group. Statistical analysis as in (a). (e) EAE scores following LacCer or vehicle administration together with the MOG(35–55) peptide to C57BL/6 mice during EAE induction, and also intraperitoneally (i.p.) every other 3 days henceforth (mean and s.e.m.). (f) EAE scores following LacCer or vehicle administration initiated at day 35 after EAE induction (progressive phase). (g) PDMP inhibits LacCer synthesis by B4GALT6. (h) Quantification of LacCer levels in the CNS of naïve or EAE NOD mice treated with PDMP or vehicle as shown in (i). (i) Clinical scores of EAE in NOD mice treated with PDMP or vehicle, administered daily (20mg/kg given i.p. twice a day) from day 40 after EAE induction (progressive phase) for the duration of the experiment Representative data of three independent experiments with n ≥ 8 mice/group). (j) Histopathology analysis of lumbar spinal cord sections from EAE NOD mice treated with PDMP or vehicle as in (i) and stained with Luxol fast blue or Bielschowsky’s silver stain for analysis of demyelination or axonal loss, respectively. Scale bar 100 µM. Representative data of two independent experiments with n ≥ 6 mice/group (mean and s.e.m.). *P<0.05, **P<0.01, ***P<0.001, n.s. not significant.

