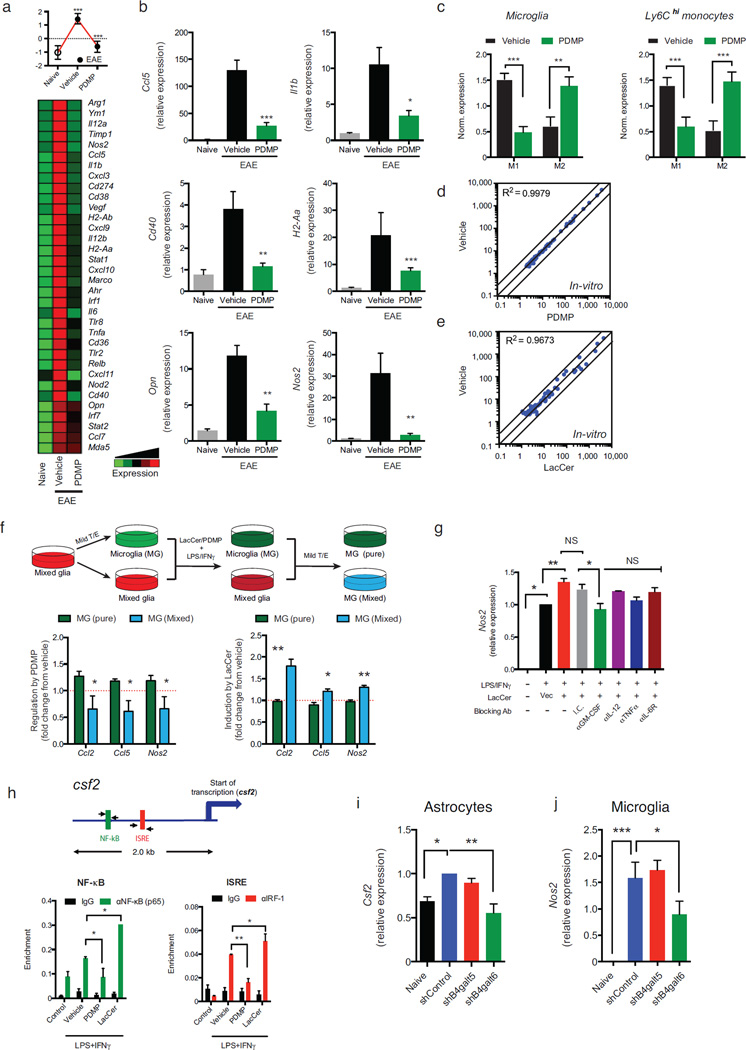
Figure 5. B4GALT6 in astrocytes regulates the activation of microglia and CNS-infiltrating monocytes.
(a) Heatmap depicting mRNA expression, as determined by nCounter Nanostring analysis, in microglia from naïve or EAE NOD mice treated with PDMP or vehicle. Representative data of three independent experiments. Statistical analysis by Student’s t-test. (b) qPCR analysis of ccl5, il1b, opn, nos2, cd40, and H2-Aa gene expression relative to Gapdh. (c) Mean normalized expression of genes associated with M1- or M2-phenotype in microglia (Supplementary Table 3) (c, left panel) and Ly6Chigh monocytes (c, right panel). Statistical analysis by Student’s t-test. (d, e) Primary microglia were pre-treated with PDMP, LacCer, or vehicle, followed by activation with LPS/IFNγ for 6h or left un-treated (control) as in (Fig. 3a). mRNA expression was determined by nCounter Nanostring analysis (d, e) was determined. Representative data of five independent experiments. (f) Mixed glia cultures were treated with mild trypsin/EDTA (T/E) to remove the astrocyte monolayer leaving only the microglia attached to the plate, or left un-treated. Cultures were pre-treated with PDMP, LacCer or vehicle, and activated with LPS/IFNγ for 6h. Following activation, both cultures were washed, and incubated with mild T/E to remove the astrocytes; thus, leaving only the microglia (MG) attached to the plates. RNA was harvested from microglia treated in the absence [MG (pure)] or presence [MG (mixed)] of astrocytes and gene expression was analyzed by qPCR for the expression ccl2, ccl5 and nos2 relative to gapdh. Data present the relative effect of PDMP (left panel) or LacCer (right panel) pre-treatment on LPS/IFNγ-triggered gene induction, from five independent experiments. Statistical analysis by Student’s t-test. (g) Mixed glia were pre-treated with indicated blocking antibodies or appropriate isotype controls (25µg/ml) and LacCer (10µM) or vehicle control, and then activated with LPS/IFNγ for 6h. Microglia were isolated as in (f), and microglial-nos2 expression was determined by qRT relative to gapdh and presented as in (f). Representative data of three independent experiments. (h) ChIP analysis of the interaction of NF- κB, and IRF-1 with the csf2 promoter in primary cultured astrocytes. (i, j) Expression csf2 in astrocytes (i) and nos2 in microglial cells (j) isolated form the CNS of chronic EAE NOD mice, 10 days after the i.c.v. injection of astrocytes-specific shRNA lentivirus as in (Fig. 3g). Data from two independent experiments. For all data, means and s.e.m. are shown. *P<0.05, **P< 0.01, ***P<0.001 and n.s. not significant.

