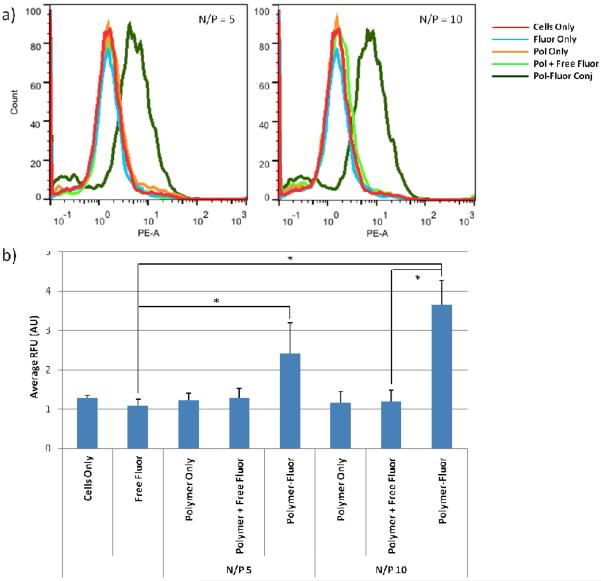
Fig. 5.
(a) Histograms representing the data and (b) average fluorescence as assessed by flow cytometry. Uptake of fluorophore, non-functionalized polyplexes, polyplexes plus free fluorophore, and fluorophore-functionalized polyplexes was monitored in HeLa cells. Data is presented as mean ± SD, n = 4. Statistically significant (P<0.05) differences are indicated with a (*).

