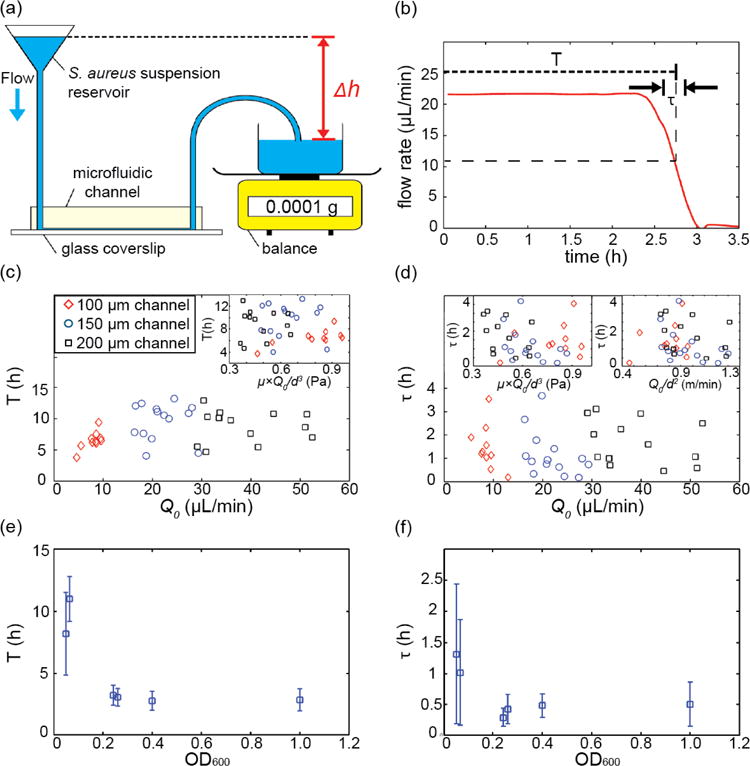
Figure 4.

Dynamics of biofilm-induced clogging for S. aureus under constant pressure drop flow conditions. (a) Schematic drawing of the experimental apparatus: early or mid exponential phase S. aureus cells are loaded into a reservoir. Using wide-bore tubing, this reservoir is connected to the microfluidic channel. The effluent collection dish is placed on an analytical balance. The height difference, Δh, between the reservoir suspension and the effluent collection dish is proportional to the applied pressure difference. (b) The weight of the effluent suspension as a function of time is converted into the flow rate, Q0, as a function of time using Eq. (8). Using this flow rate measurement, the time to clogging, T, and the duration of the clogging transition, t, were measured for each channel. (c, d) T and τ for different flow rates, shear stress, flow speeds and different channel sizes. All channels had a square cross-section, with a width and height equal to d = 100 μm, 150 μm, or 200 μm. Shear stress and flow speed were calculated as μwater × Q0/d3 and Q0/d2 where μwater is the viscosity of water (∼0.001 Pa·s). T and τ appear to be independent of channel size, flow rate, shear stress, and flow speeds for the flow rates we investigated. The suspension we flowed through the channel in these experiments was at a cell density that corresponds to OD600= 0.06 ± 0.01. (e, f) T and τ depend strongly on the bacterial cell concentration of the suspension flowed through the channel.
