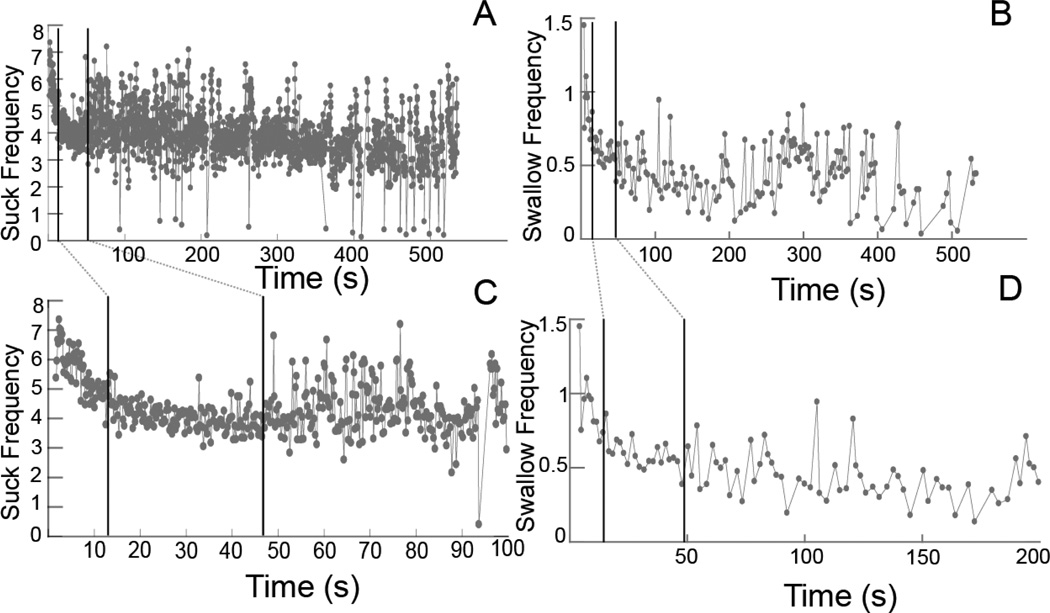
Fig. 2.
Suck and swallow frequencies over time. A, B Suck frequency and swallow frequency, respectively, against time for an entire feeding sequence, from when the animal started until it stopped feeding. C, D Details over a shorter period of time (100 and 200 s) for A and B. The dark vertical lines in each graph represent the breaks between phases. Linear models were fit to each phase for each sequence. The values of the slopes and intercepts from these models were subsequently analyzed

