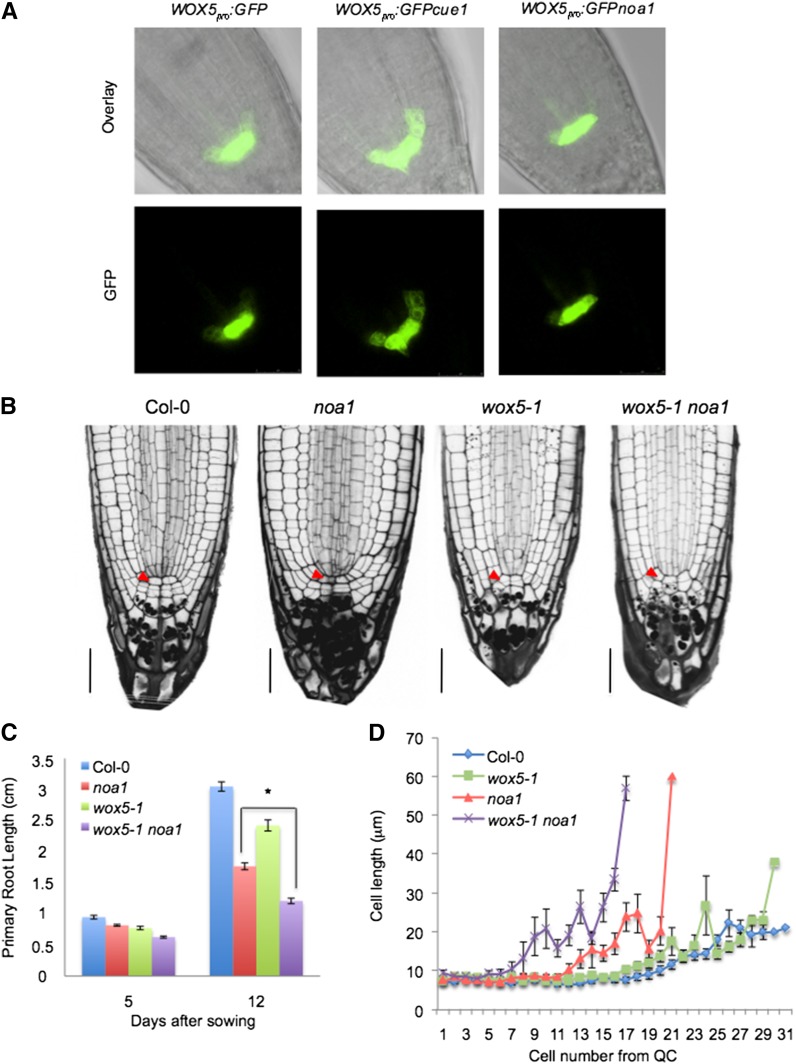
Figure 7.
NO effect in the stem cell homeostasis through WOX5. A, WOX5 marker analysis in the wild type (Col-0) and cue1 and noa1 mutants. B, Root sections of the 5-d-old wild type (Col-0) and 5-d-old noa1, wox5-1, and wox5-1 noa1 seedlings. Red arrowheads indicate QC. Bars = 30 µm. C, Primary root length in 5- and 12-d-old wild-type (Col-0) seedlings and noa1, wox5-1, and wox5-1 noa1 mutants. Error bars represent se; n > 40. *, Statistically significant difference (P < 0.05). D, Average cell sizes in the cortical cell layer (cells 1–31 from QC) of 7-d-old wox5-1, noa1, and wox5-1 noa1 mutant and wild-type (Col-0) roots grown vertically under standard conditions.

