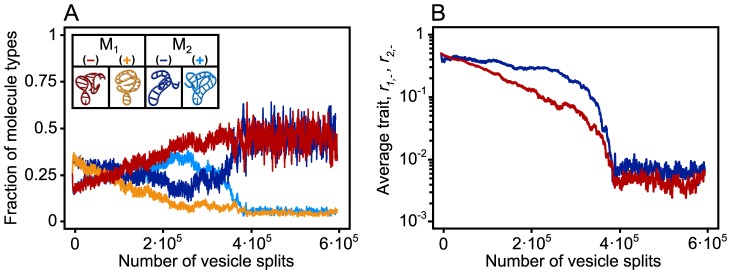
Figure 2. The evolution of division of labor between minus ( ) and plus (
 ) strands.

(A) A representative example of simulations resulting in asymmetric strand separation averaged over the population of  vesicles (
 : red;
  : orange;
  : dark blue;
  : light blue). Starting from an initially symmetric state, i.e. all strand types are represented in equal numbers (
 ), and of equal replication rates (
 ) (J denotes the mutation class with trait
  ). The trade-off in this case is assumed to be strong between the replication affinity and the catalytic activity. Hence the trait
  of the minus strand (B) gradually evolves towards lower replication rates (
 ) in order to achieve higher metabolic activity (
 ). During trait evolution the ratio of minus (dark shadings) and plus (light shadings) strands changes, and the minuses significantly increase in numbers. At stable equilibrium, for the very extreme cases, only 4–8% of the macromolecules, on average 2 or 3 per vesicle, are plus strands. Other parameters:
  ,
,  ,
,  ,
,  ,
,  ,
,  ,
,  ,
,  ,
,  ,
,  ,
,  ,
,  and
and  .
.
