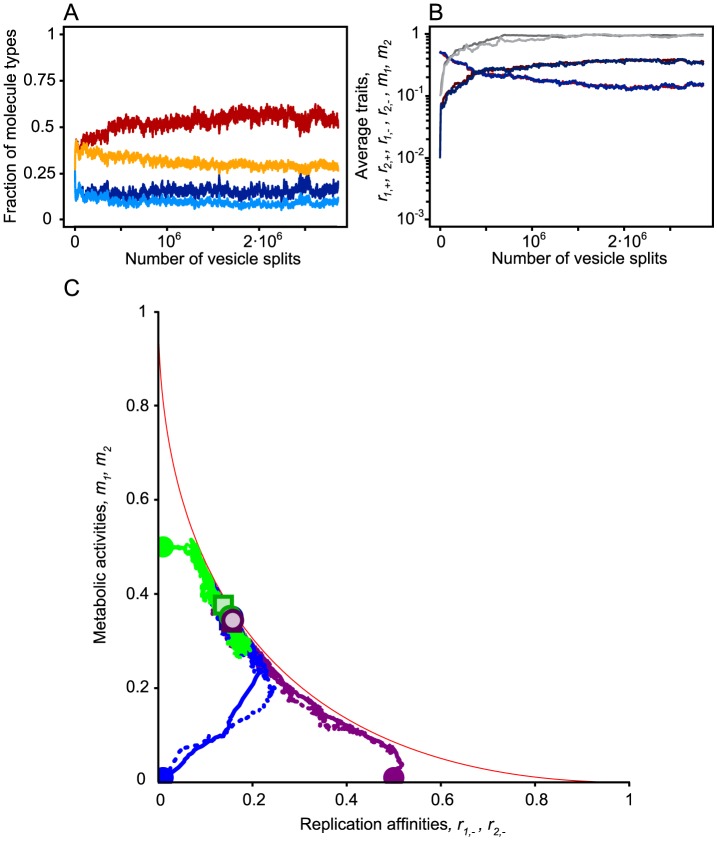
Figure 3. The evolution of division of labor when both replication affinity and metabolic activity of replicators are allowed to evolve separately.
(A) A representative example of simulations resulting in asymmetric strand template reaction averaged over the population of  vesicles (
 : red;
  : orange;
  : dark blue;
  : light blue). Simulations begin from an initially symmetric state, i.e. all strand types are represented in equal numbers (
 ) and equal template replication rates (
 ). We assume low initial metabolic activity of the minus strands (
 ) and a trade-off between the maximum values of the replication affinity and the catalytic activity of the replicators (see red line in C), i.e. no replicator can evolve traits above this boundary, but any rate combination below the curve is accessible (i.e.
  , see Models Eq. 1b). (B) As metabolic activity gradually evolves towards high values (brown and dark blue lines,
  ) the minus strands trade in replication affinity (red and blue lines,
  ) in order to reach the optimum. When the replication affinity of the plus strand can also evolve, evolution further optimizes the protocell composition in favor of strand asymmetry by evolving the highest possible affinity for the plus strand (grey and dark grey lines,
  ). Here
  is allowed to evolve without any trade-off (
 , and the initial condition is
  ). (C) Trajectories from different initial conditions (green:
  and
and  ; purple:
  and
and  ; and blue:
  and
and  ) converge to the same equilibrium. Solid and dotted lines depict molecule types 1 and 2, respectively. Filled circles represent the initial data points, while light shaded circles and rectangles represent the evolutionary endpoints for traits of molecules 1 and 2, respectively. For the above results we employed a continuous-trait model, in which traits were allowed to change continuously between 0 and 1, and mutant traits were drawn from a normal distribution with the resident trait as a mean and with variance
  . Other parameters:
  ,
,  ,
,  ,
,  ,
,  ,
,  ,
,  ,
,  ,
,  ,
,  ,
,  and
and  .
.

