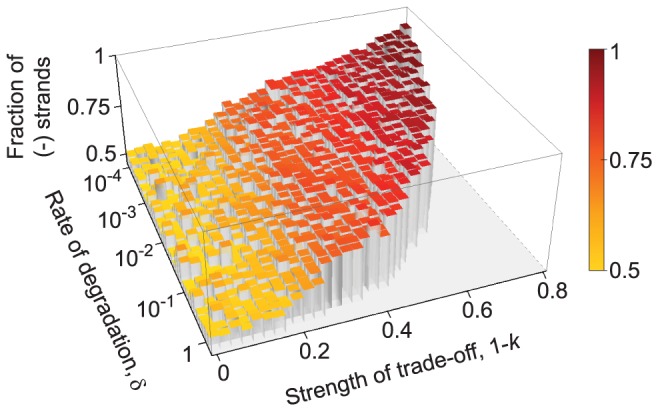
Figure 5. The effect of degradation rate of macromolecules on strand asymmetry.

The equilibrium ratio of the minus and plus strands (indicated by the heights as well as the colors of the bars; red: 0.9→yellow: 0.5) is not affected significantly by the rate of degradation, however increasing the degradation rate above a threshold results in the extinction of the replicators (notice the flat grey area on the right hand side of the graph). For strong trade-off ( ), this threshold is at a lower rate of degradation, whereas higher degradation rates are tolerated as the strength of trade-off decreases (
 ). The results are averaged over 3 replicate model runs. Other parameters:
  ,
,  ,
,  ,
,  ,
,  ,
,  ,
,  ,
,  ,
,  ,
,  and
and  .
.
