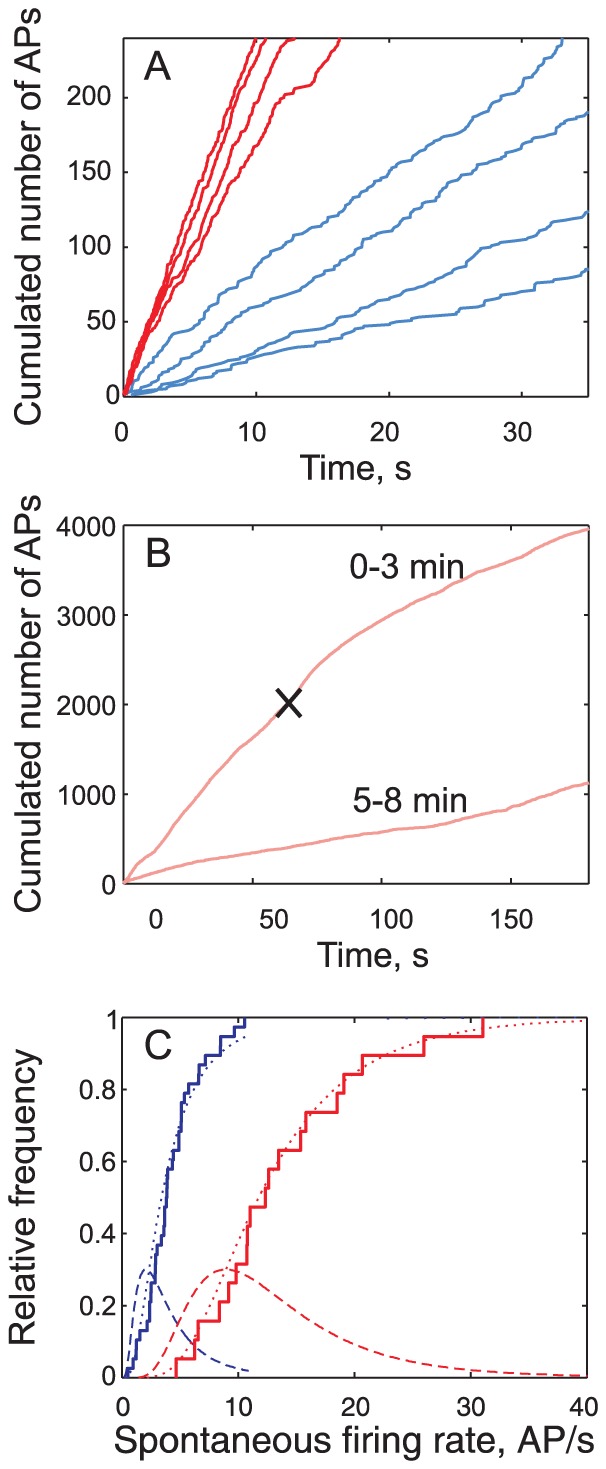
Figure 3. Spontaneous activity in PNs is higher than in ORNs and depends on ORN spontaneous activity.

(A) Total number of spontaneous spikes N sp fired from time 0 to ti (firing time of ith spike) plotted as a function of ti in 4 ORNs (blue) and 4 PNs (red). The mean spontaneous firing rate is the slope of the regression line of N sp vs. t. (B) Spontaneous activity of a PN before and after sectioning the antennal nerve (black cross); same representation as in (A). Top curve: first 3 min with sectioning marked with cross; slope of regression line before sectioning = 32 AP/s. Bottom curve: same neuron from 5 to 8 min after sectioning (slope = 5.6 AP/s). (C) Distribution of spontaneous firing rates in ORNs (blue) and PNs (red), with empirical cumulative distribution functions (CDFs, staircase), fitted lognormal CDFs (dashed curve) and corresponding probability distribution functions (PDFs, dotted curve). Parameters of these distributions are given in S2 Table.
