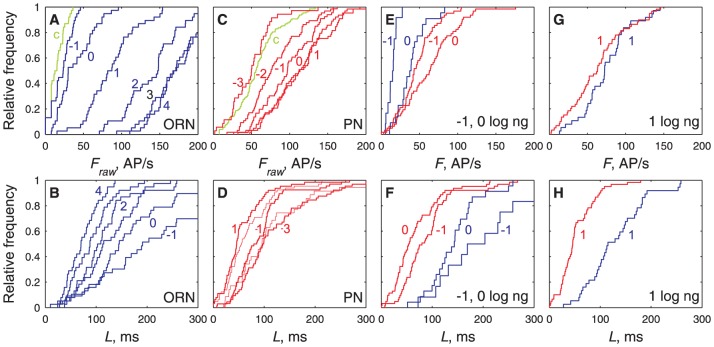
Figure 4. Distributions of firing rates (top row) and latencies (bottom row) at single pheromone doses are dose-dependent.
(A) Comparison in ORNs of raw firing rates F raw (not corrected from control stimulations) for control stimulations (green) and for pheromone doses −1, 0, 1, 2, 3, 4 log ng (blue, from left to right). F raw at C = −1 log ng not significantly different from control (Kolmogorov-Smirnov test, p = 0.43). (B) Comparison in ORNs of latencies L for same stimuli and doses (from right to left) as in (A). (C) Comparison in PNs of firing rates F raw for control stimulations (green) and for pheromone doses −3, −2, −1, 0, 1 log ng (red), same representation as in (A). F raw at C = −3 log ng not significantly different from control (Kolmogorov-Smirnov test, p = 0.43) but significantly different from F raw at C = −2 (p<10−4). (D) Comparison in PNs of latencies L for same stimuli and doses as in (C). (E, G) Comparison of firing rates F (corrected from control stimulation) in ORNs (blue) and PNs (red) at the same doses −1, 0 (in E) and 1 log ng (in G). For C≤1, the mean firing firing rates of ORNs is smaller than that of PNs. (F–H) Comparison of latencies, same representation as in (E, G). At all doses, the mean firing latency of ORNs is larger than that of PNs. At C≥1, the shortest ORN latencies become almost as short as the shortest PN latencies.

