
Figure 6. Firing rates are Hill functions of dose with different parameter values in each neuron.
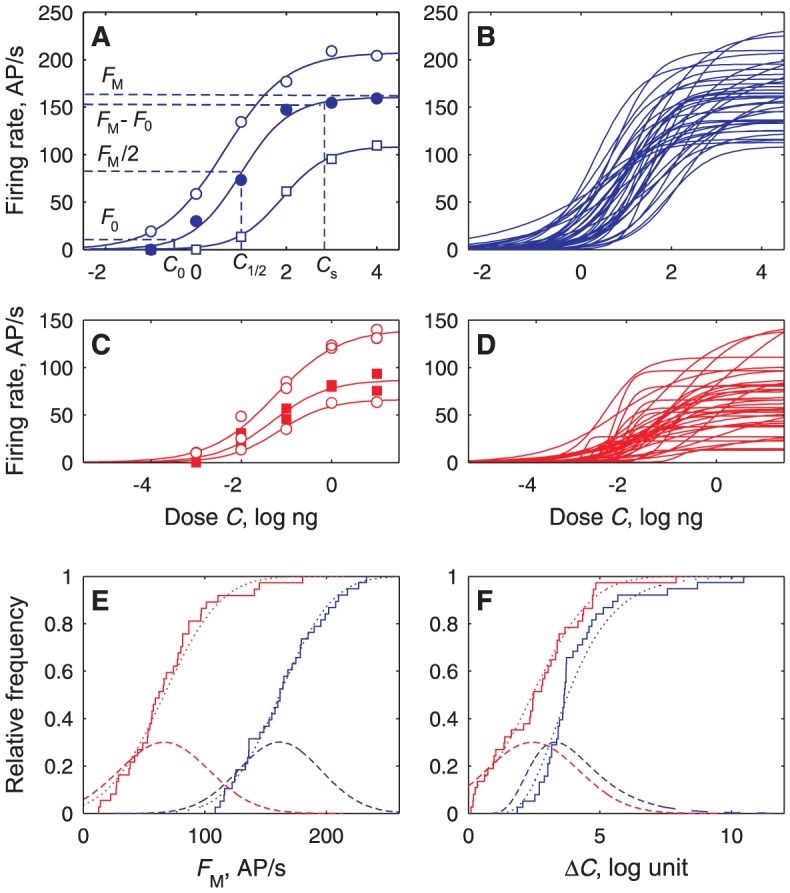
(A) Measured firing rate F (dots) of 3 ORNs fitted to Hill functions (eq. 4; solid curves) showing parameters F M and C 1/2 and characteristic C 0 and C s for F 0 = 5 AP/s. (B) All (N = 38) Hill curves fitted to ORNs. (C) Hill curves of 3 PNs. (D) All (N = 37) PN curves successfully fitted to Hill functions. (E) Distribution of maximum firing rates F M in the ORN (blue, N = 38) and PN (red, N = 37) populations. Each empirical CDF (staircase) with its fitted normal CDF (dotted curve) and corresponding PDF (dashed curve). (F) Distributions of dynamic ranges ΔC (related to n), same N and representation as in (E) except fitted distribution is lognormal for ORNs.