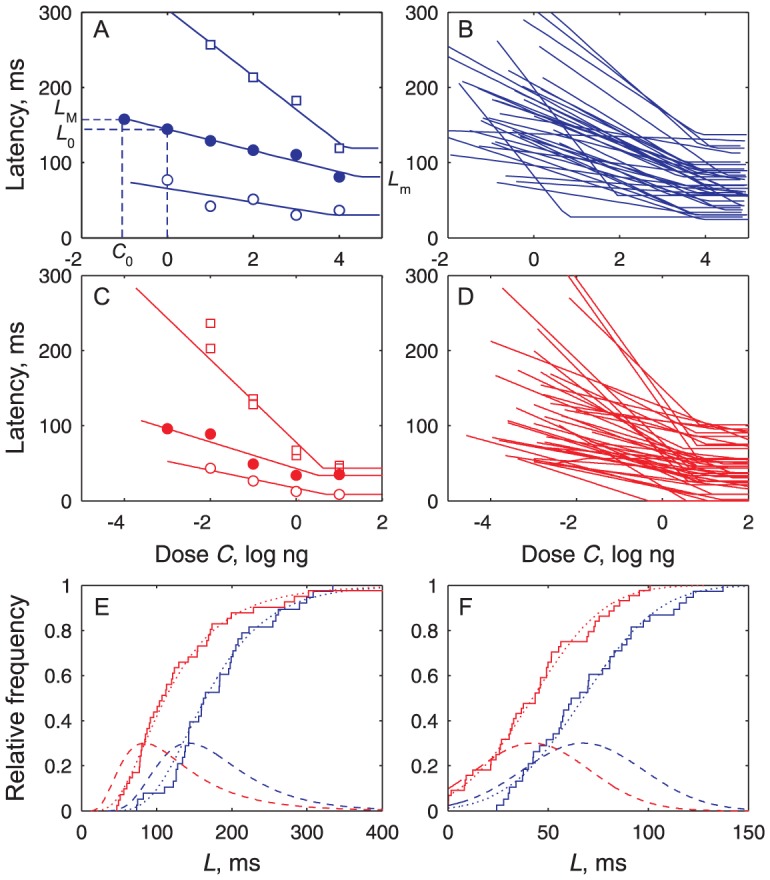
Figure 7. Latencies are linear functions of pheromone dose with different parameter values in each neuron.

(A) Measured latency L (dots) of 3 ORNs fitted to decreasing lines (eq. 8; solid curve) showing minimum latency L m and maximum latency L M at threshold C 0 given from Fig. 6A. (B) All (N = 38) fitted ORN dose-latency curves. (C) Three examples of PN latency curves. (D) All (N = 44) fitted PN dose-latency curves. (E) Maximum latencies L M at threshold dose C 0 fitted to lognormal CDFs; same N's as in (B, D) and representation as in Fig. 6E. (F) Minimum latencies L m fitted to normal CDFs; same N and representation as in (E). A few zero latencies arise in PNs from variability on pheromone transport time T t.
