
Figure 8. Dose-response curves of PNs are shifted to left of ORN curves and explain ORN-to-PN transfer functions.
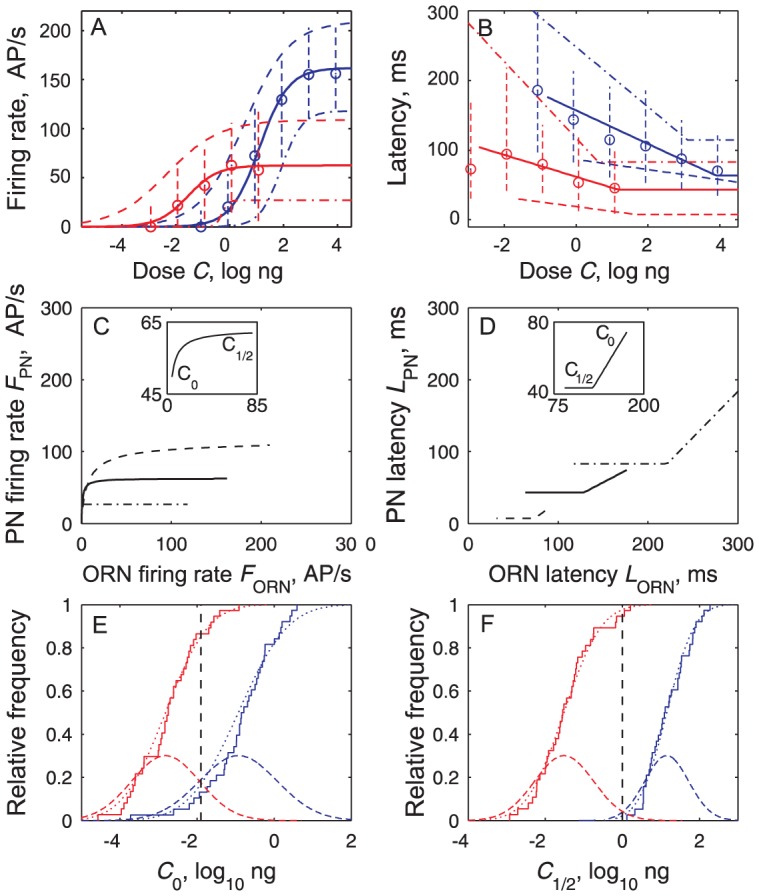
(A) Medians (circles) and quantiles 10% and 90% (vertical dashed lines) of all F measured at a given dose, as shown in Fig. 5. Dose-firing rate curves of ORN (blue) and PN (red) populations reconstructed from parameters of individual C–F curves shown in Fig. 6, based on median (solid), 10% most responsive neurons (dashed, based on quantiles 90% for F M and 10% for C 1/2, n) and 90% less responsive neurons (dash-dotted). (B) Dose-latency curves of ORNs (blue) and PNs (red) based on median, 90% and 10% quantiles. Same representations as in (A) based either on pooled L (Fig. 5) or on parameters of C-L curves (Fig. 7). (C) Median transfer function for firing rates (solid, eq. 9); it can be approximated by F PN = 62.5/(1+ (1.5/F ORN)1.15); inset: detail of most nonlinear part from threshold to ED50 of ORNs. Transfer function for the 10% most responsive neurons (dashed, derived from (A) by coupling most responsive ORNs and PNs) and for the 10% least responsive ones (dash-dotted). (D) Median transfer function for latencies running from right (low doses) to left (high doses) (solid, eq. 12); inset: linear part from threshold to ED50 of ORNs. Transfer functions for the 10% fastest neurons (dashed) and for the 10% slowest neurons (dash-dot). (E) Distributions of thresholds C 0 in ORNs (blue, N = 38) and PNs (red, N = 37); empirical CDFs (staircases) with fitted normal CDF (solid curve) and corresponding PDF (dashed curve); maximum contrast at C 0Δ = −1.9 log ng (dashed vertical line) with 17% ORNs and 85% PNs activated. (F) Distributions of ED50 C 1/2, same N's and representation as in (E); maximum contrast at C 1/2Δ = 0 log ng (dashed vertical line) with 2% of ORNs and 98% of PNs above their C 1/2.