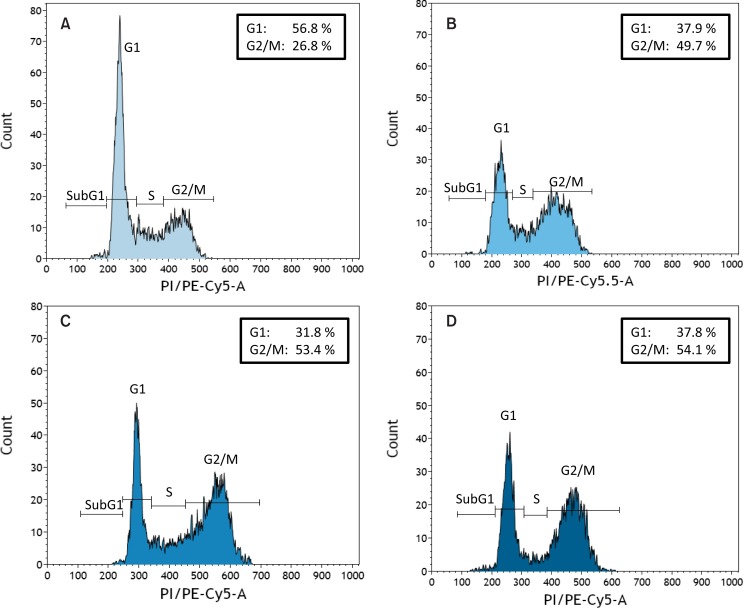
Fig. 5.
Cell cycle analysis of HaCaT keratinocytes which stayed either untreated (A) or were treated with the kINPen 09 for 60s (B), surface DBD for 120 s (C) or volume DBD for 20 s (D). Analysis was done 24 h after exposure to plasma. Representative histograms with indication of the percentage of cells detected in the G1 and G2/M phase are shown. Plasma treatment induced independent of the plasma source used a typical G2/M.

