
Figure 5.
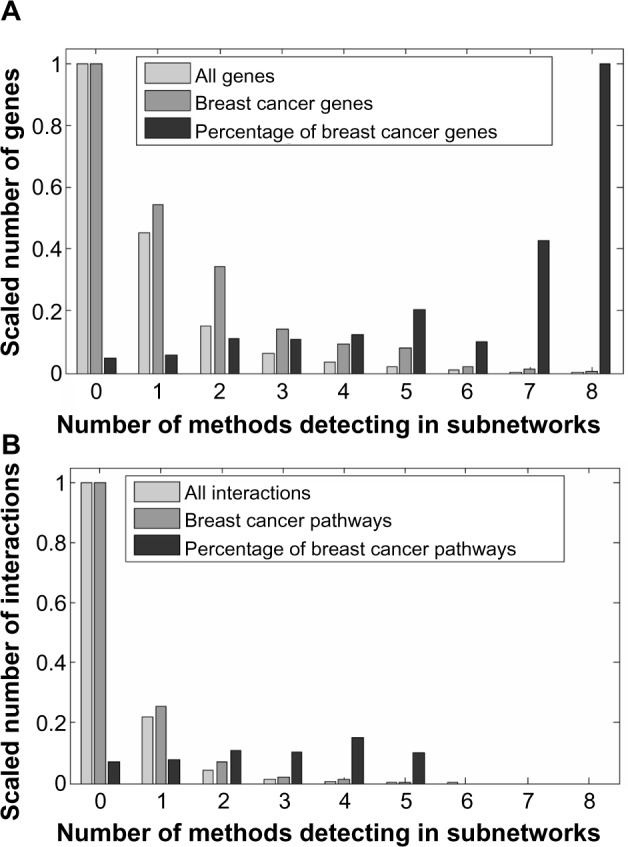
Number of methods detecting genes and interactions in subnetworks. Histograms of the number of genes (A) and interaction counts (B) versus the number of methods that detect them. (A) All genes denote the 7,369 genes in the HPRD network. Breast cancer genes are the 462 genes found by KOBAS in multiple disease databases. Both the gene counts are scaled to [0, 1] by dividing by the maximum count. The percentage of breast cancer genes is the breast cancer gene count divided by the count of all the genes in each category (genes found by a certain number of methods). (B) All interactions denote the 28,571 interactions in the HPRD network. Breast cancer pathways are the 2,058 interactions found by KOBAS in multiple pathways databases. Both the interaction counts are scaled to [0, 1] by dividing by the maximum count. The percentage of breast cancer pathways is the interaction count in breast cancer pathways divided by the total interaction count in each category.