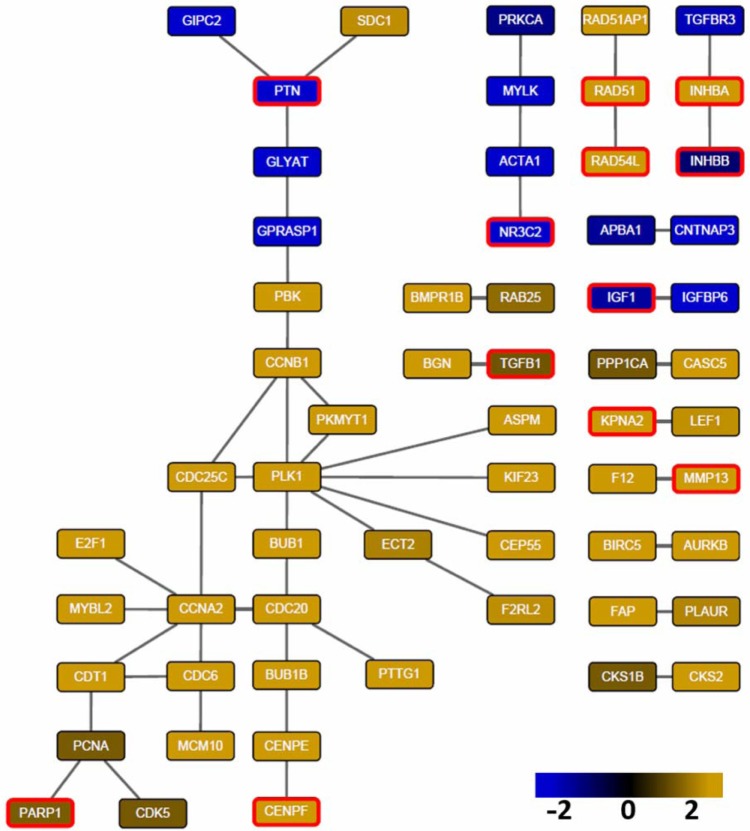
Figure 6.
Prominent subnetwork whose interactions are detected by at least five methods. Node color indicates log2 fold change of differential expression (yellow: upregulated in tumor samples; blue: downregulated in tumor samples). The 12 genes in red border are in the list of 462 known breast cancer genes. Visualized by Cytoscape 3.0 version.6

