
Figure 2.
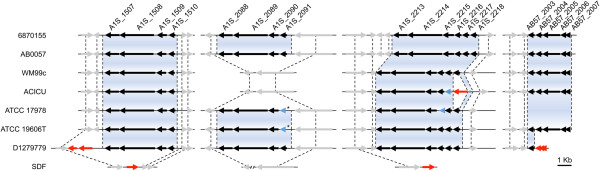
Genetic analysis of the Type I pili clusters. Genomic organization of the Type I pili clusters A1S_1507-1510, AB57_2003-2007, A1S_2088-2091 and A1S_2213-2218 (Csu-cluster) in ATCC 17978 and comparison to those in other strains. Genes have been drawn to scale. The arrows represent ORFs and depict the direction of transcription; pili components (black), adjacent homologous genes (grey), transposases (red) and inactivated genes (blue). The blue shading indicate a high level of homology between genes from different strains (E-value <10-30). The asterisks indicate the location of a polymeric tract seen in A1S_2091 and its ortholog in strain ATCC 19606T.