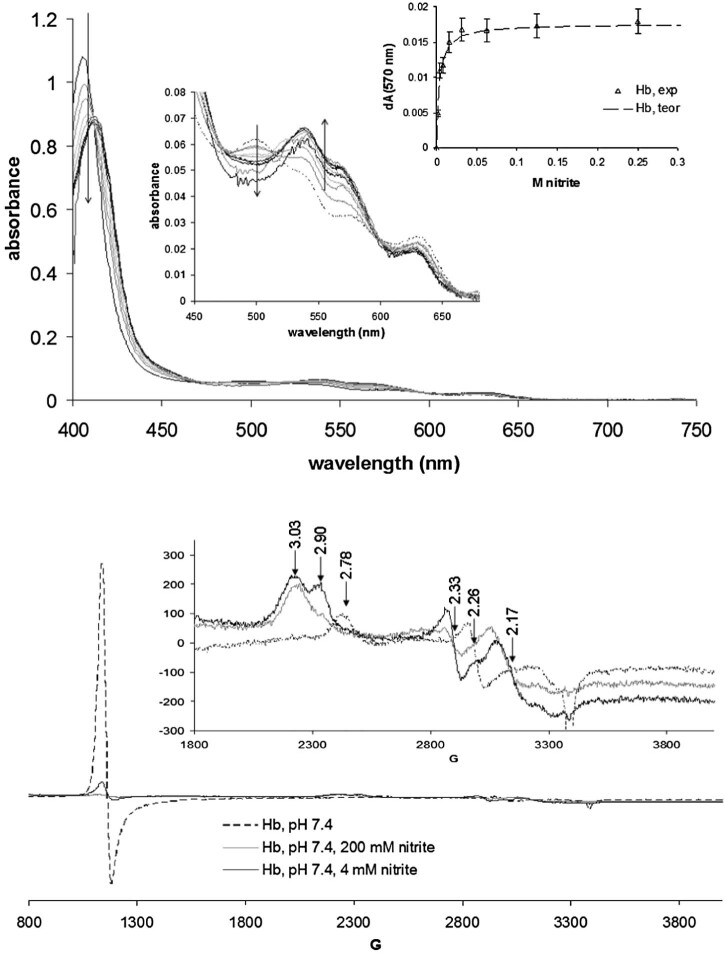
Fig. 3.
Top panel: UV-vis spectra of hemoglobin (100 µM) in the presence of varying amounts of nitrite; shown as inset is a binding curve whose theoretical fit indicates a binding constant of 3 mM. Bottom panel: EPR spectra of Hb in the presence and absence of nitrite, Conditions are as in Fig. 2.

