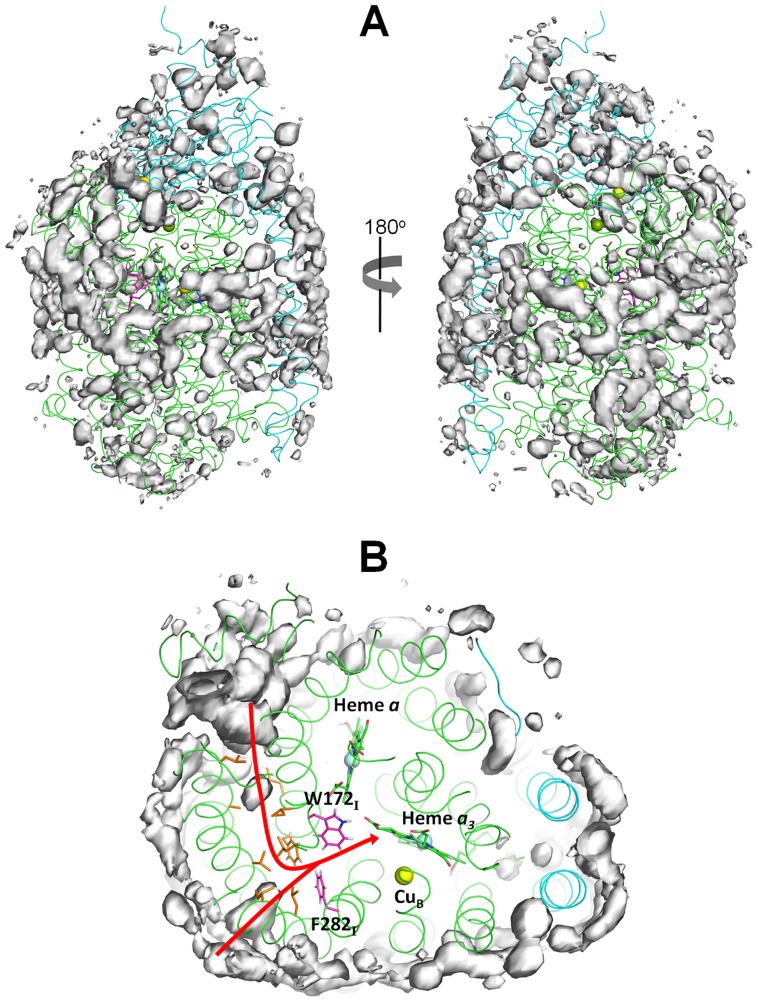
Figure 2. O2 probability density maps obtained from all-atom MD simulations.
A) The probability density contours at 0.00015 Å−3 are depicted as a grey surface. The X-ray structure is represented as a ribbon with subunit I colored in green and subunit II in cyan. The hemes are depicted as green sticks. The yellow, light blue and green spheres represent the Cu, Fe (from the heme groups) and the Mg atoms, respectively. The residues forming the putative O2 channel inferred from the X-ray structure (according to [13]) are colored in orange and the residues forming the constriction point in this channel are highlighted in magenta. B) Zoom image of the putative O2 channel inferred from the X-ray structure pressurized with xenon [13]. The red arrow identifies the two possible entrance points for this O2 channel.

