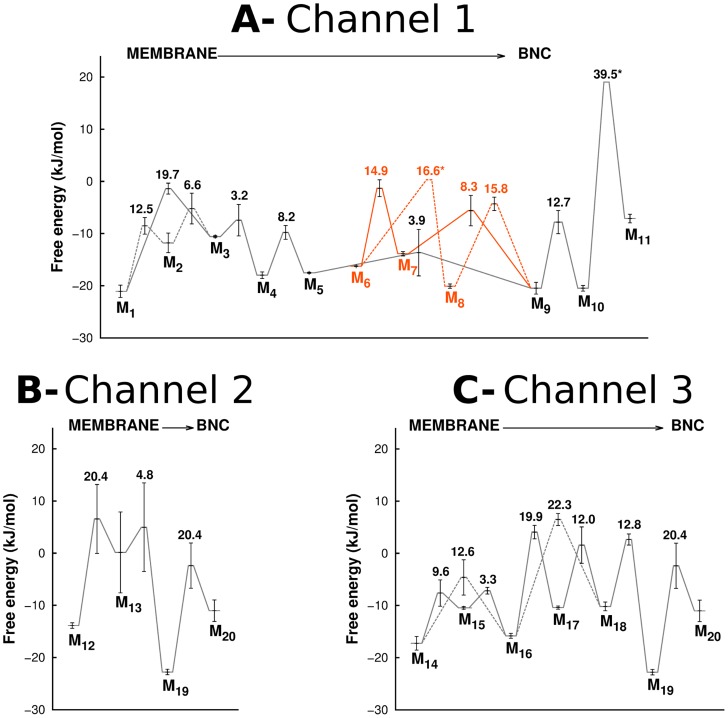
Figure 5. Free energy barriers experienced by O2.
Free energy barriers experienced by O2 when moving from the membrane region to the BNC, along Channel 1 (A), Channel 2 (B) and Channel 3 (C). For details related to the errors calculation see the data analysis section of the Materials and Methods. The “*” in the fig. indicates the transitions for which the errors could not be calculated. In Fig. A, the black lines correspond to Channel 1, which starts between helices 5 and 8 of subunit I, whereas the orange lines correspond to the second entrance point located between helices 11 and 13 of subunit I. In A and C, the dashed lines correspond to alternative routes for O2 inside the same channel (for example in Fig. C, O2 can move directly from M14 to M16, or it can go from M14 to M15 and only then to M16). The numbers inside the plots on top of the transition states indicate the free energy barriers experienced by O2 when moving from the membrane in the direction of the BNC (i.e. between the different minima on their immediate left and the transition states in question).

