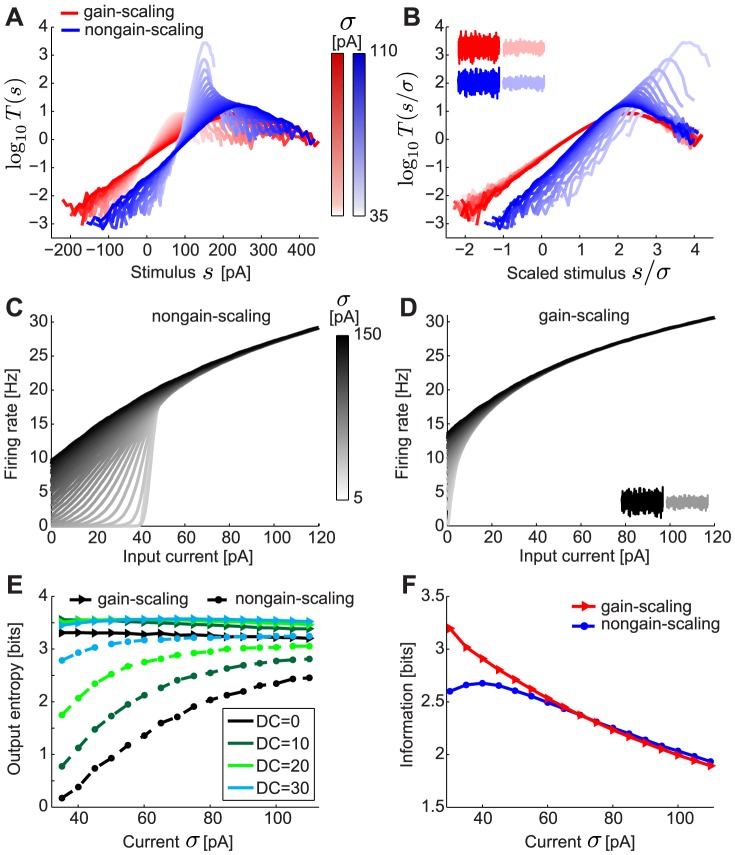
Figure 1. LN models and  –
– curves for gain-scaling (GS) and nongain-scaling (NGS) neurons.
A. The nonlinearities in the LN model framework for a GS (red) ( pS/µm2 and
  pS/µm2) and a NGS (blue) (
 pS/µm2 and
  pS/µm2) neuron simulated as conductance-based model neurons (Eq. 2). The nonlinearities were computed using Bayes' rule:
  , where
  is the neuron's mean firing rate and
  is the linearly filtered stimulus (see also Eq. 7 in Methods). B. The same nonlinearities as A, in stimulus units scaled by
  (magnitude of stimulus fluctuations). The nonlinearities overlap for GS neurons over a wide range of
  . C–D. The
  –
– curves for a NGS (C) and a GS neuron (D) for different values of
  . E. The output entropy as a function of the mean (DC) and
  (amplitude of fast fluctuations). F. Information about the output firing rate of the neurons as a function of
  .
.

