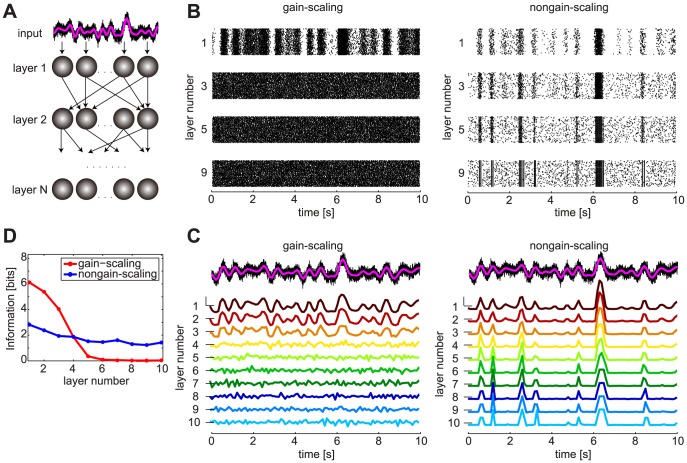
Figure 4. Information transmission through GS and NGS networks.
A. Feedforward network with a slowly modulated time-varying input (magenta) presented to all neurons in the first layer, each neuron receiving in addition an independent noisy signal (black). B. Spike rasters for GS neurons ( pS/µm2 and
  pS/µm2) show the rapid signal degradation in deeper layers, while NGS neurons (
 pS/µm2 and
  pS/µm2) exhibit reliable signal transmission of large-amplitude events. The spiking responses synchronize in deeper layers. C. PSTHs from each layer in the two networks showing the propagation of a slow-varying input in the presence of background fast fluctuations. PSTHs were normalized to mean 0 and variance 1 to illustrate fluctuations (in spite of different firing rates) so that the dashed lines next to each PSTH denote 0 and the scalebar 2 normalized units. D. Information about the slow stimulus fluctuations conveyed by the population mean responses shown in C.

