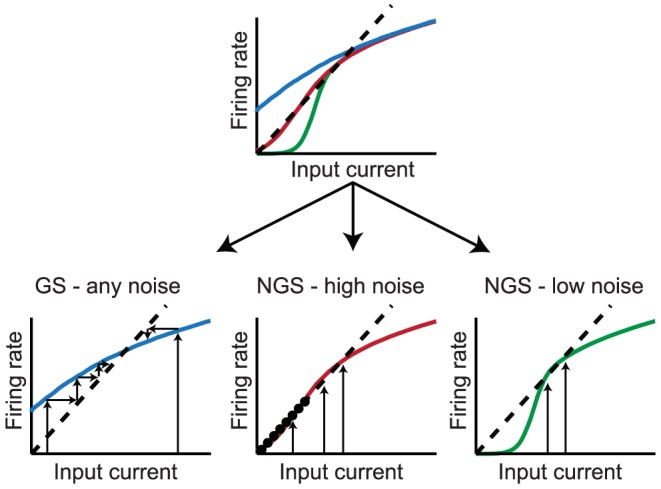
Figure 5. Fixed points of the iterated map dynamics.

Top: An illustration of three  –
– curves (colors) and the corresponding linear input-output relation (black dashed) with slope
  derived from the mean field. Bottom left: The dynamics has a single stable fixed point and all input currents are attracted to it (indicated by small arrows converging to the fixed point). This corresponds to
  –
– curves of GS neurons at all values of
  . Middle: The dynamics has a line of stable fixed points that allow robust transmission of a large range of input currents in the network. NGS neurons with high values of
  have such dynamics. Right: The stable line of fixed points is smaller for
  –
– curves that are more "thresholding,'' corresponding to NGS neurons with low
  .
.
